Tuggerah Lakes PFAS ambient sampling program
A 6-month pilot sampling program tested for background or 'ambient' PFAS in the Central Coast lake system.
The program found that all results were below ecological and recreational guidelines. While PFAS is widespread in the environment, it is usually in low concentrations and presents a low risk to the environment and human health.
Background
A number of activities within the catchment are associated with PFAS – these include landfills, historic use of firefighting foams, on-site sewage management systems, large infrastructure and maintenance facilities, and power stations.
Water sampling program
We worked with Department of Climate Change, Energy, the Environment and Water (DCCEEW) to take monthly samples at 19 different locations around the lakes system for a range of PFAS.
PFAS is a class of more than 4000 chemicals including PFOS and PFHxS. They are highly persistent, bioaccumulate, can move long distances and break down extremely slowly in the environment.
Sampling results and guidance
- PFAS was identified at all 19 locations on at least one occasion
- Results from the 6 sampling rounds show PFAS at levels below recreational and ecological water quality guidelines on all occasions at all 19 locations tested
- PFAS concentrations within the Tuggerah Lakes catchment are consistent with the ambient concentrations in urban catchments in QLD, WA and Victoria
- PFAS is widespread but typically present at low concentrations, resulting in a low risk of exposure and adverse effects to the environment and human health
- The community can safely continue to use the lake system for swimming and recreational purposes including swimming, boating and canoeing
- Highest concentrations of PFAS were measured in Lake Munmorah and Porters Creek
- PFAS concentrations were generally elevated at estuarine sites, reflecting the higher degree of urbanisation and development in these lower-catchment areas
PFAS in the environment
Finding PFAS in the environment does not necessarily mean there is a risk to human health but it is important to assess if there are exposure pathways through which people might ingest PFAS.
Most people are exposed to small amounts of PFAS in everyday life as it has been commonly used in the manufacture of many household and industrial products. This includes stain resistant applications for furniture and carpets, non-stick cookware, fast food or packaged food containers, make up, personal care products, paints and cleaning products as well historically in some firefighting foams.
More information can be found at NSW Health.
Guidelines
PFOS and PFOA were assessed against the Australian and New Zealand water quality guidelines for ecosystem protection (ANZG 2023 and 2026), as well as the NHMRC recreational water guidelines (2019).
In March 2026, the Australian and New Zealand ecological water quality guidelines for PFOS were revised, setting the 99% species protection guideline at 0.02 µg/L.
Under these new guidelines, all results from the sampling program were below the ecological value.
Concentrations of PFOS below this guideline pose a low risk of toxicity to aquatic organisms but may not adequately protect other animals due to bioaccumulation.
Next steps
Following the pilot, the ambient monitoring program has been expanded to more than 200 sites across NSW.
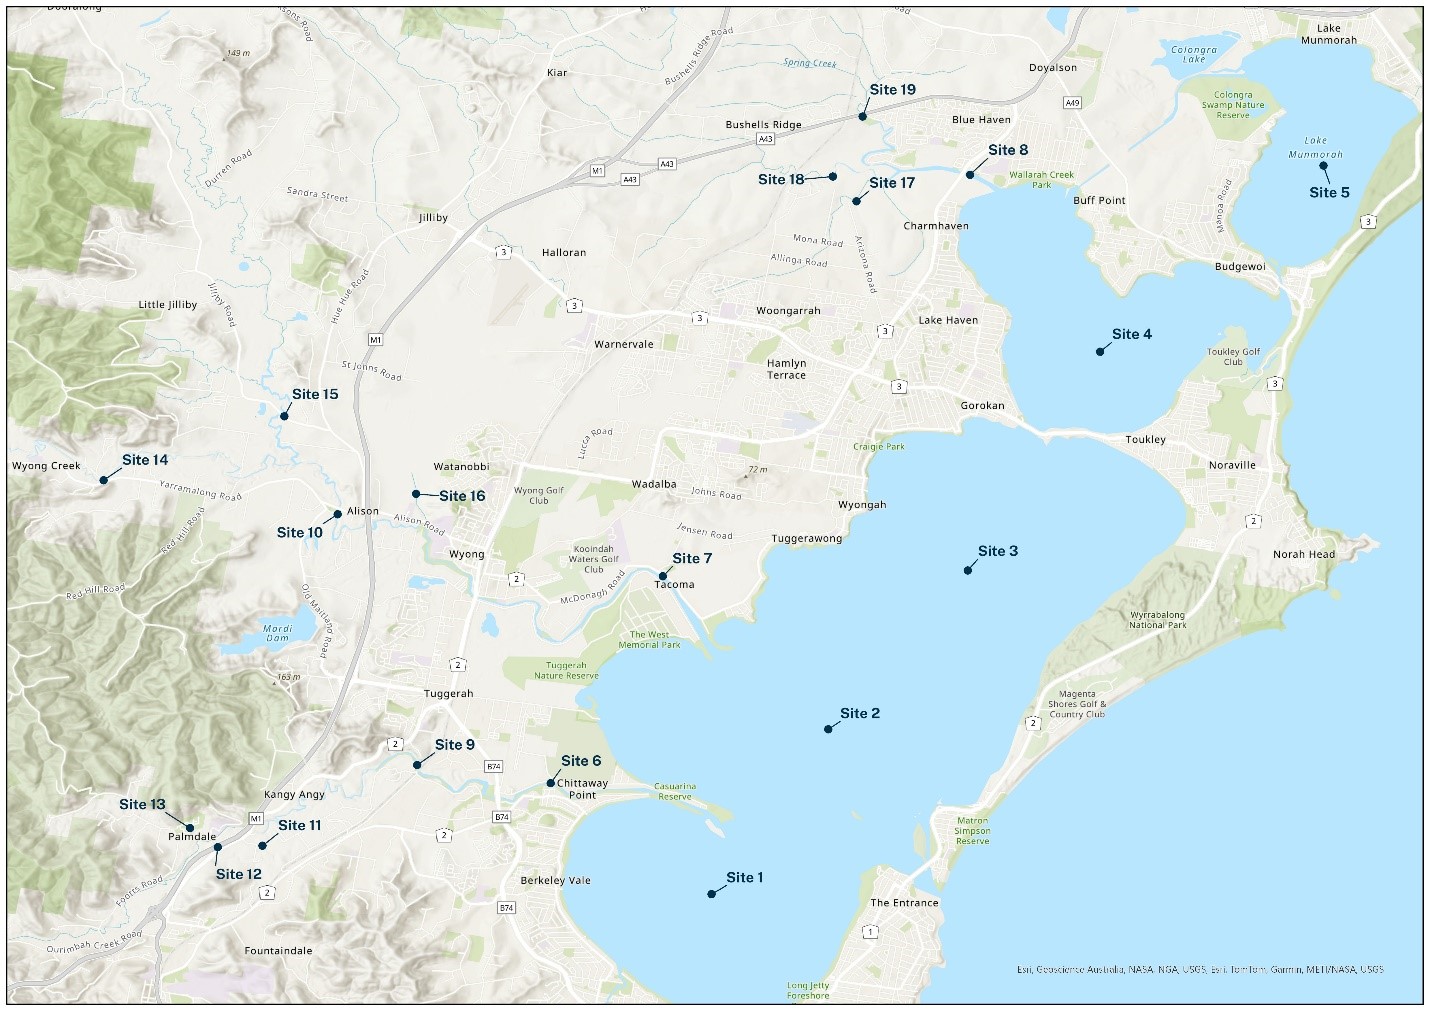
PFAS levels at sampling locations
This table shows PFAS levels at this site that have a recreational and/or ecological guideline value.
| Sample dates | Guideline | |||||||
|---|---|---|---|---|---|---|---|---|
| PFAS | 5/8/25 | 2/9/25 | Oct (30/9/25) | 3/11/25 | 4/12/25 | 14/1/26 | Recreational water (NHMRC 2019) | Ecological (ANZG 2023 and 2026) |
| Results and guideline values are expressed in µg/L. | ||||||||
| PFOS | 0.001 | 0.002 | 0.001 | 0.001 | 0.001 | 0.001 | 0.02 | |
| PFOA | 0.0004 | 0.0006 | 0.0005 | 0.0006 | 0.0008 | 0.0008 | 10 | 19 |
| PFOS + PFHxS | 0.0016 | 0.0029 | 0.0016 | 0.002 | 0.0019 | 0.002 | 2 | |
This table shows PFAS levels at this site that have a recreational and/or ecological guideline value.
| Sample dates | Guideline | |||||||
|---|---|---|---|---|---|---|---|---|
| PFAS | 5/8/25 | 2/9/25 | Oct (30/9/25) | 3/11/25 | 4/12/25 | 14/1/26 | Recreational water (NHMRC 2019) | Ecological (ANZG 2023 and 2026) |
| Results and guideline values are expressed in µg/L. | ||||||||
| PFOS | 0.0009 | 0.001 | 0.001 | 0.002 | 0.001 | 0.001 | 0.02 | |
| PFOA | 0.0004 | 0.0007 | 0.0007 | 0.0005 | 0.0007 | 0.0007 | 10 | 19 |
| PFOS + PFHxS | 0.0013 | 0.0019 | 0.0016 | 0.003 | 0.0018 | 0.002 | 2 | |
This table shows PFAS levels at this site that have a recreational and/or ecological guideline value.
| Sample dates | Guideline | |||||||
|---|---|---|---|---|---|---|---|---|
| PFAS | 5/8/25 | 2/9/25 | Oct (30/9/25) | 3/11/25 | 4/12/25 | 14/1/26 | Recreational water (NHMRC 2019) | Ecological (ANZG 2023 and 2026) |
| Results and guideline values are expressed in µg/L. | ||||||||
| PFOS | 0.001 | 0.002 | 0.001 | 0.001 | 0.001 | 0.002 | 0.02 | |
| PFOA | 0.0005 | 0.0006 | 0.0007 | 0.0005 | 0.0007 | 0.0008 | 10 | 19 |
| PFOS + PFHxS | 0.0017 | 0.0028 | 0.0016 | 0.003 | 0.0019 | 0.003 | 2 | |
This table shows PFAS levels at this site that have a recreational and/or ecological guideline value.
| Sample dates | Guideline | |||||||
|---|---|---|---|---|---|---|---|---|
| PFAS | 5/8/25 | 2/9/25 | Oct (30/9/25) | 3/11/25 | 4/12/25 | 14/1/26 | Recreational water (NHMRC 2019) | Ecological (ANZG 2023 and 2026) |
| Results and guideline values are expressed in µg/L. | ||||||||
| PFOS | 0.002 | 0.0022 | 0.0023 | 0.0021 | 0.0021 | 0.0027 | 0.02 | |
| PFOA | 0.0007 | 0.0008 | 0.0009 | 0.0007 | 0.0009 | 0.001 | 10 | 19 |
| PFOS + PFHxS | 0.0029 | 0.0042 | 0.0033 | 0.0045 | 0.0031 | 0.0037 | 2 | |
This table shows PFAS levels at this site that have a recreational and/or ecological guideline value.
| Sample dates | Guideline | |||||||
|---|---|---|---|---|---|---|---|---|
| PFAS | 5/8/25 | 2/9/25 | Oct (30/9/25) | 3/11/25 | 4/12/25 | 14/1/26 | Recreational water (NHMRC 2019) | Ecological (ANZG 2023 and 2026) |
| Results and guideline values are expressed in µg/L. | ||||||||
| PFOS | 0.0042 | 0.004 | 0.0045 | 0.004 | 0.0041 | 0.0045 | 0.02 | |
| PFOA | 0.001 | 0.001 | 0.001 | 0.001 | 0.002 | 0.002 | 10 | 19 |
| PFOS + PFHxS | 0.0063 | 0.0067 | 0.007 | 0.0113 | 0.0072 | 0.0075 | 2 | |
This table shows PFAS levels at this site that have a recreational and/or ecological guideline value.
| Sample dates | Guideline | |||||||
|---|---|---|---|---|---|---|---|---|
| PFAS | 5/8/25 | 2/9/25 | Oct (30/9/25) | 3/11/25 | 4/12/25 | 14/1/26 | Recreational water (NHMRC 2019) | Ecological (ANZG 2023 and 2026) |
| Results and guideline values are expressed in µg/L. | ||||||||
| PFOS | 0.0009 | 0.001 | 0.002 | 0.002 | 0.0025 | 0.0023 | 0.02 | |
| PFOA | 0.0004 | 0.0006 | 0.0007 | 0.0008 | 0.0009 | 0.001 | 10 | 19 |
| PFOS + PFHxS | 0.0015 | 0.002 | 0.004 | 0.0074 | 0.0046 | 0.0043 | 2 | |
This table shows PFAS levels at this site that have a recreational and/or ecological guideline value.
| Sample dates | Guideline | |||||||
|---|---|---|---|---|---|---|---|---|
| PFAS | 5/8/25 | 2/9/25 | Oct (30/9/25) | 3/11/25 | 4/12/25 | 14/1/26 | Recreational water (NHMRC 2019) | Ecological (ANZG 2023 and 2026) |
| Results and guideline values are expressed in µg/L. | ||||||||
| PFOS | 0.0008 | 0.0008 | 0.001 | 0.001 | 0.002 | 0.002 | 0.02 | |
| PFOA | 0.0004 | 0.0004 | 0.0007 | 0.0006 | 0.0006 | 0.0007 | 10 | 19 |
| PFOS + PFHxS | 0.0011 | 0.0013 | 0.0019 | 0.003 | 0.0026 | 0.0028 | 2 | |
This table shows PFAS levels at this site that have a recreational and/or ecological guideline value.
| Sample dates | Guideline | |||||||
|---|---|---|---|---|---|---|---|---|
| PFAS | 5/8/25 | 2/9/25 | Oct (30/9/25) | 3/11/25 | 4/12/25 | 14/1/26 | Recreational water (NHMRC 2019) | Ecological (ANZG 2023 and 2026) |
| Results and guideline values are expressed in µg/L. | ||||||||
| PFOS | 0.002 | 0.002 | 0.002 | 0.0027 | 0.0023 | 0.0037 | 0.02 | |
| PFOA | 0.0006 | 0.001 | 0.0009 | 0.0009 | 0.001 | 0.002 | 10 | 19 |
| PFOS + PFHxS | 0.0027 | 0.004 | 0.003 | 0.0061 | 0.0043 | 0.0057 | 2 | |
This table shows PFAS levels at this site that have a recreational and/or ecological guideline value.
| Sample dates | Guideline | |||||||
|---|---|---|---|---|---|---|---|---|
| PFAS | 5/8/25 | 2/9/25 | Oct (30/9/25) | 3/11/25 | 4/12/25 | 14/1/26 | Recreational water (NHMRC 2019) | Ecological (ANZG 2023 and 2026) |
| Results and guideline values are expressed in µg/L. | ||||||||
| PFOS | 0.0009 | 0.001 | 0.001 | 0.002 | 0.0022 | 0.0023 | 0.02 | |
| PFOA | 0.0003 | 0.0005 | 0.0007 | 0.0008 | 0.0009 | 0.0009 | 10 | 19 |
| PFOS + PFHxS | 0.0014 | 0.002 | 0.003 | 0.0091 | 0.0049 | 0.0043 | 2 | |
This table shows PFAS levels at this site that have a recreational and/or ecological guideline value.
| Sample dates | Guideline | |||||||
|---|---|---|---|---|---|---|---|---|
| PFAS | 5/8/25 | 2/9/25 | Oct (30/9/25)_ | 3/11/25 | 4/12/25 | 14/1/26 | Recreational water (NHMRC 2019) | Ecological (ANZG 2023 and 2026) |
| Results and guideline values are expressed in µg/L. | ||||||||
| PFOS | 0.0002 | ND | ND | 0.0003 | ND | ND | 0.02 | |
| PFOA | ND | ND | ND | ND | ND | 0.0003 | 10 | 19 |
| PFOS + PFHxS | 0.0002 | ND | ND | 0.0006 | ND | ND | 2 | |
This table shows PFAS levels at this site that have a recreational and/or ecological guideline value.
| Sample dates | Guideline | |||||||
|---|---|---|---|---|---|---|---|---|
| PFAS | 5/8/25 | 2/9/25 | Oct (30/9/25) | 3/11/25 | 4/12/25 | 14/1/26 | Recreational water (NHMRC 2019) | Ecological (ANZG 2023 and 2026) |
| Results and guideline values are expressed in µg/L. | ||||||||
| PFOS | 0.002 | 0.002 | 0.0021 | 0.0024 | 0.0022 | 0.0027 | 0.02 | |
| PFOA | 0.0007 | 0.001 | 0.001 | 0.002 | 0.002 | 0.002 | 10 | 19 |
| PFOS + PFHxS | 0.0028 | 0.004 | 0.0041 | 0.0056 | 0.0044 | 0.0047 | 2 | |
This table shows PFAS levels at this site that have a recreational and/or ecological guideline value.
| Sample dates | Guideline | |||||||
|---|---|---|---|---|---|---|---|---|
| PFAS | 5/8/25 | 2/9/25 | Oct (30/9/25) | 3/11/25 | 4/12/25 | 14/1/26 | Recreational water (NHMRC 2019) | Ecological (ANZG 2023 and 2026) |
| Results and guideline values are expressed in µg/L. | ||||||||
| PFOS | 0.0006 | 0.001 | 0.002 | 0.002 | 0.0026 | 0.0026 | 0.02 | |
| PFOA | 0.0004 | 0.0003 | 0.0005 | 0.0004 | 0.0006 | 0.001 | 10 | 19 |
| PFOS + PFHxS | 0.0011 | 0.002 | 0.0043 | 0.0089 | 0.0063 | 0.0054 | 2 | |
This table shows PFAS levels at this site that have a recreational and/or ecological guideline value.
| Sample dates | Guideline | |||||||
|---|---|---|---|---|---|---|---|---|
| PFAS | 5/8/25 | 2/9/25 | Oct (30/9/25) | 3/11/25 | 4/12/25 | 14/1/26 | Recreational water (NHMRC 2019) | Ecological (ANZG 2023 and 2026) |
| Results and guideline values are expressed in µg/L. | ||||||||
| PFOS | 0.0003 | ND | 0.0003 | 0.0003 | 0.0003 | 0.0003 | 0.02 | |
| PFOA | ND | ND | ND | ND | 0.0004 | 0.0003 | 10 | 19 |
| PFOS + PFHxS | 0.0003 | 0.0002 | 0.0003 | 0.0008 | 0.0007 | 0.0003 | 2 | |
This table shows PFAS levels at this site that have a recreational and/or ecological guideline value.
| Sample dates | Guideline | |||||||
|---|---|---|---|---|---|---|---|---|
| PFAS | 5/8/25 | 2/9/25 | Oct (30/9/25) | 3/11/25 | 4/12/25 | 14/1/26 | Recreational water (NHMRC 2019) | Ecological (ANZG 2023 and 2026) |
| Results and guideline values are expressed in µg/L. | ||||||||
| PFOS | ND | ND | ND | ND | ND | ND | 0.02 | |
| PFOA | ND | ND | ND | ND | ND | ND | 10 | 19 |
| PFOS + PFHxS | ND | ND | ND | 0.0003 | ND | ND | 2 | |
This table shows PFAS levels at this site that have a recreational and/or ecological guideline value.
| Sample dates | Guideline | |||||||
|---|---|---|---|---|---|---|---|---|
| PFAS | 5/8/25 | 2/9/25 | Oct (30/9/25) | 3/11/25 | 4/12/25 | 14/1/26 | Recreational water (NHMRC 2019) | Ecological (ANZG 2023 and 2026) |
| Results and guideline values are expressed in µg/L. | ||||||||
| PFOS | 0.0005 | ND | 0.0003 | ND | 0.0003 | 0.0004 | 0.02 | |
| PFOA | ND | 0.0002 | ND | ND | ND | 0.0003 | 10 | 19 |
| PFOS + PFHxS | 0.0005 | ND | 0.0003 | 0.0004 | 0.0003 | 0.0004 | 2 | |
This table shows PFAS levels at this site that have a recreational and/or ecological guideline value.
| Sample dates | Guideline | |||||||
|---|---|---|---|---|---|---|---|---|
| PFAS | 5/8/25 | 2/9/25 | Oct (30/9/25) | 3/11/25 | 4/12/25 | 14/1/26 | Recreational water (NHMRC 2019) | Ecological (ANZG 2023 and 2026) |
| Results and guideline values are expressed in µg/L. | ||||||||
| PFOS | 0.0042 | 0.0034 | 0.0048 | 0.0027 | 0.001 | 0.0057 | 0.02 | |
| PFOA | 0.0026 | 0.0021 | 0.0028 | 0.001 | 0.0006 | 0.0036 | 10 | 19 |
| PFOS + PFHxS | 0.0066 | 0.0054 | 0.007 | 0.0047 | 0.0016 | 0.0096 | 2 | |
This table shows PFAS levels at this site that have a recreational and/or ecological guideline value.
| Sample dates | Guideline | |||||||
|---|---|---|---|---|---|---|---|---|
| PFAS | 5/8/25 | 2/9/25 | Oct (30/9/25) | 3/11/25 | 4/12/25 | 14/1/26 | Recreational water (NHMRC 2019) | Ecological (ANZG 2023 and 2026) |
| Results and guideline values are expressed in µg/L. | ||||||||
| PFOS | 0.0025 | 0.0022 | 0.0024 | 0.0033 | 0.0024 | 0.0043 | 0.02 | |
| PFOA | 0.001 | 0.001 | 0.0009 | 0.001 | 0.001 | 0.002 | 10 | 19 |
| PFOS + PFHxS | 0.0035 | 0.0042 | 0.0034 | 0.0057 | 0.0034 | 0.0063 | 2 | |
This table shows PFAS levels at this site that have a recreational and/or ecological guideline value.
| Sample dates | Guideline | |||||||
|---|---|---|---|---|---|---|---|---|
| PFAS | 5/8/25 | 2/9/25 | Oct (30/9/25) | 3/11/25 | 4/12/25 | 14/1/26 | Recreational water (NHMRC 2019) | Ecological (ANZG 2023 and 2026) |
| Results and guideline values are expressed in µg/L. | ||||||||
| PFOS | 0.0009 | 0.002 | 0.002 | 0.0024 | 0.0023 | 0.0037 | 0.02 | |
| PFOA | 0.0003 | 0.0009 | 0.0007 | 0.001 | 0.001 | 0.001 | 10 | 19 |
| PFOS + PFHxS | 0.0012 | 0.003 | 0.003 | 0.0066 | 0.0033 | 0.0057 | 2 | |
This table shows PFAS levels at this site that have a recreational and/or ecological guideline value.
| Sample dates | Guideline | |||||||
|---|---|---|---|---|---|---|---|---|
| PFAS | 5/8/25 | 2/9/25 | Oct (30/9/25) | 3/11/25 | 4/12/25 | 14/1/26 | Recreational water (NHMRC 2019) | Ecological (ANZG 2023 and 2026) |
| Results and guideline values are expressed in µg/L. | ||||||||
| PFOS | 0.001 | 0.001 | 0.002 | 0.0023 | 0.002 | 0.0032 | 0.02 | |
| PFOA | 0.0005 | 0.0007 | 0.0008 | 0.0008 | 0.0005 | 0.001 | 10 | 19 |
| PFOS + PFHxS | 0.0016 | 0.002 | 0.003 | 0.0045 | 0.0027 | 0.0042 | 2 | |
Notes about sampling results
The results accurately reflect PFAS levels at the time samples were collected. Concentrations of chemicals can change over time however, due to more chemicals entering or being broken down in the environment and the movement of water in rivers and lakes.
General information about sampling results:
- Sampling was undertaken in accordance with national agreed sampling guidelines. Additional types of PFAS are also being sampled to help inform the ambient program.
- The 99% species protection level for the ecological guidelines for PFOA and PFOS is always used because PFAS bioaccumulates and biomagnifies in wildlife. This means it accumulates and increases its concentration in the tissues of living things as it travels up the food chain.
- The approach to the ecological guidelines is consistent with the National Environment Management Plan 3.0 (NEMP) for PFAS.