
Litter composition by items
The graphs in this section show the composition of litter data recorded by the KLIS in 2020–21.
Most-littered items
The graph below shows the top ten most-littered items recorded by the KLIS in 2020–21.
Confectionary wrappers and snack bags, straws and other food packaging items are the top three litter items, accounting for nearly a quarter of all litter.
The top 10 items account for 58% of all litter items.
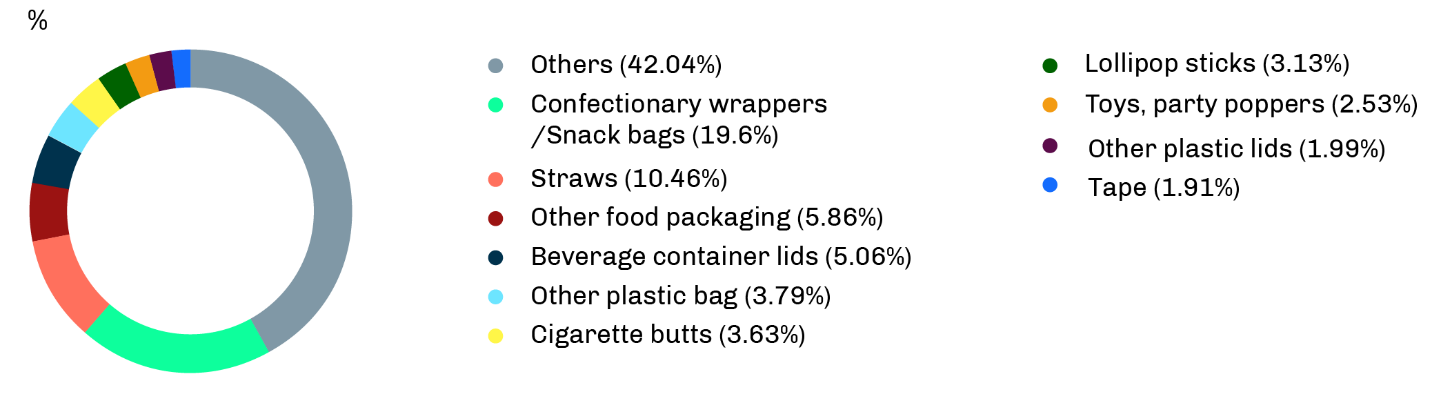
Composition of NSW litter by item, 2020–21
Litter by category
All items have been grouped into similar categories, often based on how the items are used and consumed. Using categories helps inform program and policy responses.
The figure below shows the categories of litter recorded by the KLIS in 2020–21.
The takeaway and beverage and confectionary and snacks categories account for over 50% of all litter items.
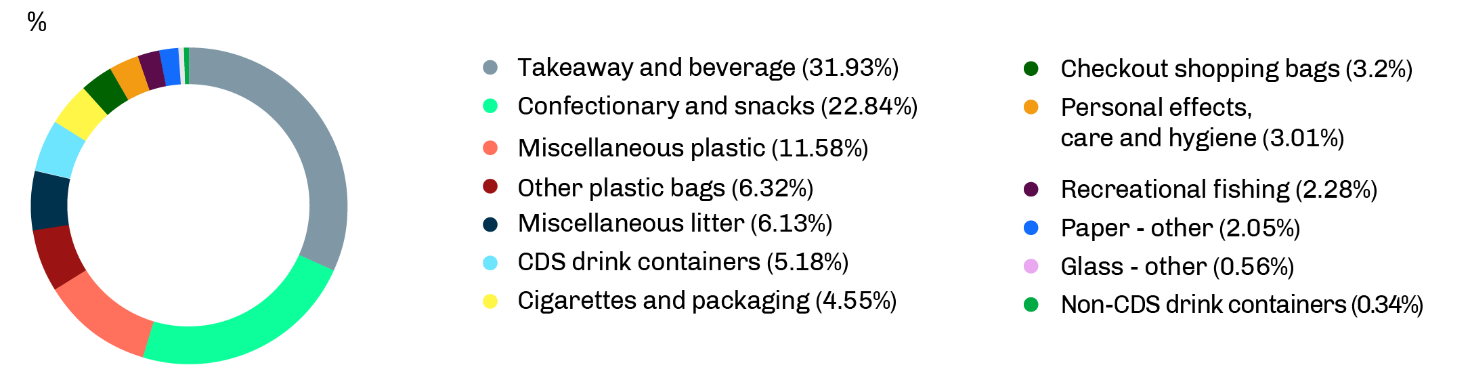
Composition of NSW litter by category, 2020–21
Litter by material
The figure below shows the material makeup of litter recorded by the KLIS in 2020–21.
Over 80% of the litter is plastic. It should be noted that the KLIS was carried out in estuaries. Plastic litter is likely to predominate in an estuarine environment because paper-based litter is susceptible to breaking up, and heavy litter, such as metal and glass, is more likely to sink. Land-based litter measure such as the National Litter Index indicate paper items can make up to 40% of the litter stream.
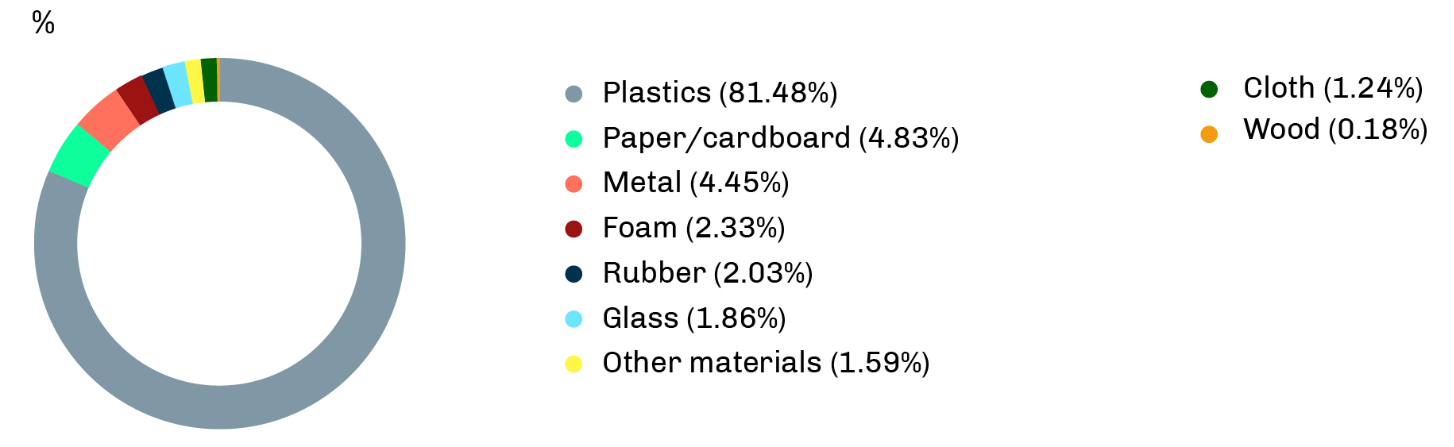
Composition of NSW litter by material, 2020–21