
Menindee fish deaths follow up: Darling-Barka River water tests
The EPA has concluded an investigation into the cause of the Darling-Barka major fish deaths in February and March 2023.
Water and fish samples were tested to determine if any offence, including any water pollution offence, under the Protection of the Environment Operations Act 1997 (POEO Act) was the cause.
After careful consideration, the likely cause of both incidents was low dissolved oxygen (hypoxic water) in the Weir Pool where the fish deaths occurred. This finding aligns with the Chief Scientist and Engineer report.
Several environmental factors, including weather, algae, fish biomass and the long-term decline in river health contributed to the conditions.
No regulatory action will be taken at this time.
The EPA will consider the recommendations of the Chief Scientist and Engineer Report and continue to work with other NSW Government agencies to monitor Menindee Lakes. This includes promptly identifying a decline in water quality to reduce the likelihood of major fish deaths in the future.
Test results for water and fish samples, with links to laboratory reports are listed below.
Summary reports
The Department of Planning and Environment (DPE) collected thirteen water samples between 13 to 14 September 2023 at Menindee, and further downstream along the lower Darling-Barka River.
Surface and bottom water samples were checked for excess nitrogen, phosphorus, and ammonia. Surface water samples were also checked for algae and algal toxins.
Surface water samples were collected at shallow sites (samples 1, 2, 8, and 16 to 20). Surface and bottom samples were collected at deep sites (samples 3 to 7).
Samples were not collected from the Great Darling Anabranch, and some of the routine locations along the Lower Darling Barka during this sampling round (samples 9 to 15).
Summary
Nitrogen and phosphorus
Nitrogen and phosphorous levels are high. If nitrogen and phosphorus stay high, they can cause algal blooms.
Algae and algal toxins
Blue-green algae were detected in all samples, but potentially toxic blue-green algae were detected in only six of the surface water samples (samples 1, 8 and 10-13). The algal toxin Cylindrospermopsin was not detected in any samples.
Sample locations
On 13 to 14 September 2023, thirteen samples were collected from the Menindee Weir Pools and the lower Darling-Barka River. The correlating sample identifications are given in brackets for reference to the full laboratory report data. Surface samples were collected from the uppermost 50 cm of water, while bottom water samples were obtained from the layer of water situated within 50 cm above the sediment bed.
- Sample 1 (B1) – Lake Wetherell upstream of the Main Weir (Surface)
- Sample 2 (B2) – Outlet of Lake Pamamaroo into Darling River (Surface)
- Sample 3 (E1) – Upper weir pool (Surface and Bottom)
- Sample 4 (E2) – Mid weir pool (Surface and Bottom)
- Sample 5 (E3) – Menindee town (Surface and Bottom)
- Sample 6 (E4) – Downstream Menindee town (Surface and Bottom)
- Sample 7 (E5) – Lower weir pool downstream Lake Menindee inflow (Surface and Bottom)
- Sample 8 (B3) – Outlet of Lake Menindee into Darling-Barka River (Surface)
- Sample 16 (E11) – Bindara Station Reach (Surface)
- Sample 17 (E12) – Karoola Station Reach (Surface)
- Sample 18 (E13) – Coona Point Reach (Surface)
- Sample 19 (E14) – Mullingar Station Reach (Surface)
- Sample 20 (E15) – Old wharf at Pooncarie (Surface)


More sampling
The DPE are conducting regular water quality monitoring on the Darling-Barka River from upstream of Menindee to Pooncarie. The test results from these samples will also be published on this website. Through the River Health Project, DPE Science have installed four telemetered loggers which collect real-time data on water quality in the project area.
In-field measurements
At the time of sampling, the DPE collected surface in-field measurements for pH, dissolved oxygen, conductivity, temperature, and turbidity.
pH was outside the guideline value for some samples in the Menindee and Lower Darling-Barka regions.
All parameters were within the expected ranges.
| Sample | Location | Temp (°C) | Dissolved oxygen (mg/L) | Electrical conductivity (µS/cm) | pH | Turbidity (NTU) |
|---|---|---|---|---|---|---|
|
1 (B1) |
Lake Wetherell upstream of the Main Weir |
16.9 |
11.4 |
591 |
8.7 |
10.0 |
|
2 (B2) |
Outlet of Lake Pamamaroo into Darling River |
15.1 |
9.4 |
513 |
8.5 |
21.7 |
|
3 (E1) |
Upper weir pool |
15.1 |
9.8 |
512 |
8.5 |
23.4 |
|
4 (E2) |
Mid weir pool |
15.7 |
10.0 |
560 |
8.5 |
17.0 |
|
5 (E3) |
Menindee town |
16.6 |
10.2 |
552 |
8.5 |
17.1 |
|
6 (E4) |
Downstream Menindee town |
16.4 |
10.1 |
542 |
8.5 |
21.0 |
|
7 (E5) |
Lower weir pool downstream Lake Menindee inflow |
16.6 |
9.5 |
544 |
8.4 |
27.0 |
|
8 (B3) |
Outlet of Lake Menindee into Darling-Barka River |
13.5 |
9.1 |
352 |
8.3 |
52.7 |
|
16 (E11) |
Bindara Station reach |
17.1 |
9.5 |
545 |
8.3 |
42.8 |
|
17 (E12) |
Karoola Station reach |
18.0 |
11.2 |
578 |
8.5 |
36.4 |
|
18 (E13) |
Coona Point reach |
17.0 |
11.7 |
553 |
8.8 |
43.6 |
|
19 (E14) |
Mullingar Station reach |
nm |
nm |
nm |
nm |
nm |
|
20 (E15) |
Old wharf at Pooncarie |
16.7 |
11.9 |
515 |
8.9 |
57.5 |
nm = Not measured
Nitrogen, Phosphorus, and Ammonia
Surface and bottom sample results show that total nitrogen and total phosphorous are higher than the acceptable levels given for lowland river ecosystems in NSW (ANZG 2018, which are in agreement with the regionally specific set of guideline values for the Murray-Darling outlined in the Basin Plan 2012). Total nitrogen was detected up to 2.5 times higher than the guideline value while total phosphorous was detected at up to 3.5 times higher. Algal blooms are possible if these nutrients remain elevated.
Bacteria convert nitrogen compounds such as ammonia into nitrite and nitrate. These compounds can harm aquatic organisms. The ammonia was also below the Australian and New Zealand water quality guidelines for toxicity. While the levels would not be expected to be harmful to fish, the ammonia could promote growth in algae and macrophytes. The ammonia is likely to be from river sources including rotting fish and flood organic matter rather than diffuse inputs from surrounding land.
Download the full test results
13 September
- Report for algal identification 13 September – Menindee weir pools
- Report for algal toxins 13 September – Menindee weir pools
- Report for TSS and nutrients 13 September – Menindee weir pools
14 September
References
ANZG (2018), Australian and New Zealand Guidelines for Fresh and Marine Water Quality, Australian and New Zealand Governments and Australian state and territory governments, Canberra ACT, Australia. Available at www.waterquality.gov.au/anz-guidelines
Basin Plan (2012), Schedule 11, Water Act 2007, Murray-Darling Basin Authority, Commonwealth of Australia
The Department of Planning and Environment (DPE) collected twenty water samples between 22 to 24 August 2023 at Menindee along the Darling-Barka River, downstream along the lower Darling-Barka River, and along the Great Darling Anabranch.
Samples were checked for excess nitrogen and phosphorus, ammonia, algae and algal toxins. Surface and bottom samples were taken.
Pesticides and metals samples were not collected (see below).
Summary
Pesticides and metals
Pesticide and metal analyses in water have been completed routinely between March and July 2023 with no pesticide detections, and all metals except copper measuring below levels set to protect water life. Copper has consistently measured above the level set to protect water life in various samples across the regions, yet well below the level harmful to fish. For these reasons, both pesticides and metals sampling have been reduced to occur approximately every three months. All other routine analyses will continue at the same frequency.
Nitrogen and phosphorus
Nitrogen and phosphorous levels are high. If nitrogen and phosphorus stay high, they can cause algal blooms.
Algae and algal toxins
Blue-green algae were detected in all samples, but potentially toxic blue-green algae were only detected in twelve of the surface samples (samples 1, 6, and 11 to 20). The algal toxin Cylindrospermopsin was also detected in several of the surface samples (10 to 12 and 18 to 20).
Sample locations
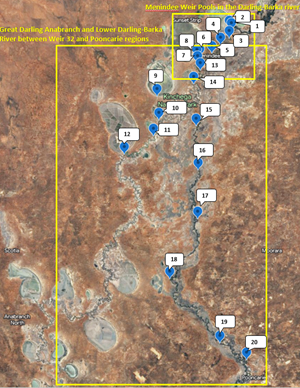
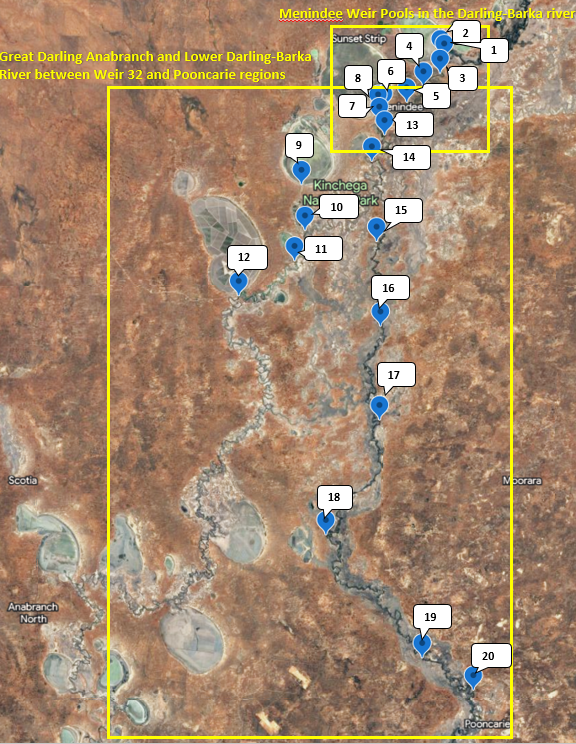
Water was sampled between 22 and 24 August 2023 from twenty locations on the Darling-Barka River at Menindee, downstream along the lower Darling-Barka River, and along the Great Darling Anabranch. Surface samples were collected from the uppermost 50 cm of water, while bottom water samples were obtained from the layer of water situated within 50 cm above the sediment bed.
On 22 August 2023, eight samples were collected from the Menindee Weir Pools in the Darling-Barka River. The correlating sample identifications are given in brackets for reference to the full laboratory report data.
- Sample 1 (B1) – Lake Wetherell upstream of the Main Weir (surface)
- Sample 2 (B2) – Outlet of Lake Pamamaroo into Darling River (surface)
- Sample 3 (E1) – Upper weir pool (surface and bottom)
- Sample 4 (E2) – Mid weir pool (surface and bottom)
- Sample 5 (E3) – Menindee town (surface and bottom)
- Sample 6 (E4) – Downstream Menindee town (surface and bottom)
- Sample 7 (E5) – Lower weir pool downstream Lake Menindee inflow (surface and bottom)
- Sample 8 (B3) – Outlet of Lake Menindee into Darling-Barka River (surface)
On 23 August 2023, four surface samples were collected from the Great Darling Anabranch region and three surface samples from the Lower Darling-Barka River between Weir 32 and Pooncarie.
- Sample 9 (B4) – Lake Cawndilla outlet into the anabranch of Darling River
- Sample 10 (E6) – Redbank Creek upstream of Cawndilla Channel confluence
- Sample 11 (E6.5) – Tandou Creek at Tandou Woolshed Rd (incorporating inflows from Kangaroo Lake)
- Sample 12 (E7) – Tandou Creek at Packers Crossing (incorporating inflows from Packers Lake)
- Sample 13 (E8) – Kinchega National Park upper
- Sample 14 (E9) – Kinchega National Park mid (incorporating inflows from Emu Lake)
- Sample 15 (E10) – Kinchega National Park lower (upstream of Anabranch offtake)
On 24 August 2023, five surface samples were collected from the Lower Darling-Barka River between Weir 32 and Pooncarie.
- Sample 16 (E11) – Bindara Station Reach
- Sample 17 (E12) – Karoola Station reach
- Sample 18 (E13) – Coona Point reach
- Sample 19 (E14) – Mullingar Station reach
- Sample 20 (E15) – Old wharf at Pooncarie


More sampling
The DPE are conducting regular water quality monitoring on the Darling-Barka River from upstream of Menindee to Pooncarie as well as the Great Darling Anabranch. The test results from these samples will also be published on this website. Through the River Health Project, DPE Science have installed four telemetered loggers which collect real-time data on water quality in the project area.
In-field measurements
At the time of sampling, the DPE collected in-field surface measurements for pH, dissolved oxygen, conductivity, temperature and turbidity.
pH was outside the guideline value for some samples in the Great Darling Anabranch and Lower Darling-Barka regions.
Dissolved oxygen at the Redbank Ck upstream of Cawndilla Channel confluence was 3.9mg/L. Native fish and other large aquatic organisms require at least 2mg/L of dissolved oxygen to survive but may begin to suffer if levels are below 4 to 5mg/L for prolonged periods.
Sample 12, collected from the Great Darling Anabranch region at Tandou Ck at Packers Crossing, was super-saturated with oxygen and had very high nutrient concentrations. When water holds as much dissolved oxygen as it can at a specific temperature, it is said to be saturated with oxygen. The oxygen saturation and nutrient load is likely due to a cyanobacteria bloom at the time. The sample location is adjacent to a complex wetland system and is prone to high variability in water quality.
All other parameters were within the expected ranges.
| Sample | Location | Temp (°C) | Dissolved oxygen (mg/L) | Electrical conductivity (µS/cm) | pH | Turbidity (NTU) |
|---|---|---|---|---|---|---|
|
1 (B1) |
Lake Wetherell upstream of the Main Weir |
13.8 |
5.3 |
546 |
7.9 |
12.7 |
|
2 (B2) |
Outlet of Lake Pamamaroo into Darling River |
15.0 |
10.0 |
517 |
8.4 |
24.5 |
|
3 (E1) |
Upper weir pool |
14.9 |
9.8 |
537 |
8.4 |
25.3 |
|
4 (E2) |
Mid weir pool |
14.4 |
9.6 |
480 |
8.3 |
30.0 |
|
5 (E3) |
Menindee town |
14.2 |
8.8 |
507 |
8.1 |
22.5 |
|
6 (E4) |
Downstream Menindee town |
14.8 |
9.4 |
520 |
8.2 |
24.0 |
|
7 (E5) |
Lower weir pool downstream Lake Menindee inflow |
14.3 |
8.7 |
550 |
8.1 |
23.3 |
|
8 (B3) |
Outlet of Lake Menindee into Darling-Barka River |
14 |
8.4 |
346.2 |
8.3 |
34.3 |
|
9 (B4) |
Lake Cawndilla outlet into the anabranch of Darling River |
14.3 |
12.1 |
366.1 |
8.9 |
21.1 |
|
10 (E6) |
Redbank Creek upstream of Cawndilla Channel confluence |
13.5 |
3.9 |
449.9 |
8.2 |
203.6 |
|
11 (E6.5) |
Tandou Creek at Tandou Woolshed Rd (incorporating inflows from Kangaroo Lake) |
17.3 |
13.0 |
399.3 |
9.1 |
37.9 |
|
12 (E7) |
Tandou Creek at Packers Crossing (incorporating inflows from Packers Lake) |
17.0 |
17.2 |
416.8 |
9.3 |
17.4 |
|
13 (E8) |
Kinchega National Park upper |
14.0 |
9.1 |
524.0 |
8.1 |
23.3 |
|
14 (E9) |
Kinchega National Park mid (incorporating inflows from Emu Lake) |
13.5 |
9.0 |
544.0 |
8.1 |
27.4 |
|
15 (E10) |
Kinchega National Park lower |
14.1 |
9.2 |
544.0 |
8.1 |
37.2 |
|
16 (E11) |
Bindara Station reach |
13.8 |
5.3 |
546.2 |
7.9 |
12.7 |
|
17 (E12) |
Karoola Station reach |
nm |
nm |
nm |
nm |
nm |
|
18 (E13) |
Coona Point reach |
nm |
nm |
nm |
nm |
nm |
|
19 (E14) |
Mullingar Station reach |
nm |
nm |
nm |
nm |
nm |
|
20 (E15) |
Old wharf at Pooncarie |
nm |
nm |
nm |
nm |
nm |
mm = not measured nr = no reliable measurement
Nitrogen, Phosphorus, and Ammonia
Sample results show that total nitrogen and total phosphorous are higher than the acceptable levels given for lowland river ecosystems in NSW (ANZG 2018, which are in agreement with the regionally specific set of guideline values for the Murray-Darling outlined in the Basin Plan 2012). The average total nitrogen was detected to be up to three times higher than the guideline value while the average total phosphorous was detected at up to five times higher. Algal blooms are possible if these nutrients remain elevated.
Bacteria convert nitrogen compounds such as ammonia into nitrite and nitrate. These compounds can harm aquatic organisms. Ammonia was well below the Australian and New Zealand water quality guidelines for toxicity. While the levels would not be expected to be harmful to fish, the ammonia could promote growth in algae and macrophytes. The ammonia is likely to be from river sources including rotting fish and flood organic matter rather than diffuse inputs from surrounding land.
Download the full test results
22 August
- Report for algal identification – Menindee weir pools
- Report for algal toxins – Menindee weir pools
- Report for TSS and nutrients – Menindee Weir Pools
23 August
- Report for algal identification – Anabranch
- Report for algal toxins – Anabranch
- Report for TSS and nutrients – Anabranch
24 August
References
ANZG (2018), Australian and New Zealand Guidelines for Fresh and Marine Water Quality, Australian and New Zealand Governments and Australian state and territory governments, Canberra ACT, Australia. Available at www.waterquality.gov.au/anz-guidelines
Basin Plan (2012), Schedule 11, Water Act 2007, Murray-Darling Basin Authority, Commonwealth of Australia
The Department of Planning and Environment (DPE) collected 8 water and 15 sediment samples between 8 to 9 August 2023 at Menindee along the Darling-Barka River.
Samples were checked for excess nitrogen and phosphorus, ammonia, and algae. Sediment samples were checked for metals and pesticides.
The remaining 12 sites usually collected from the Great Darling Anabranch and lower Darling-Barka River were not sampled due to sampling teams being assigned to collect sediment samples at Menindee along the Darling-Barka. The sediment sampling sites are marked in Figure 1.
Pesticide and metal analyses in water have been completed routinely between March and July 2023 with no pesticide detections, and all metals except copper measuring below levels set to protect water life. Copper has consistently measured above the level set to protect water life in various samples across the regions, yet well below the level harmful to fish. For these reasons, both pesticides and metals sampling have been reduced to occur approximately every three months. All other routine analyses will continue at the same frequency.
Summary
Nitrogen and phosphorus
Nitrogen and phosphorous levels are high. If nitrogen and phosphorus remain high, they can cause algal blooms.
Algae
Blue-green algae were detected in all samples, but potentially toxic blue-green algae were detected in only three of the samples.
See current information about alerts at WaterNSW
Sediment contaminants
All metals but Nickel were below sediment quality guidelines threshold values outlined within the Australian and New Zealand Guidelines for Fresh and Marine Water Quality (ANZG (2018)).
Stable isotope data indicated that sediments in this region varied with a low-moderate carbon content (0.1 - 2.0%).
Sample locations
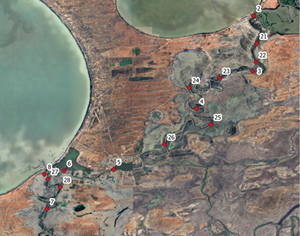
On 8 August 2023, 15 sediment samples were collected from the Menindee Weir Pools, to understand how sediment effects oxygen concentrations in the water column, and the accumulation of potential contaminants (metals, pesticides and herbicides) after the floods. Fifteen sites were sampled along the weir pool, between the outlet of Lake Pamamaroo into Darling River and Lower weir pool downstream Lake Menindee inflow. Seven of the fifteen sediment samples aligned with previous water sampling sites (samples 2-8). Samples were analysed for sediment properties such as grain size, stable isotopes, metals and pesticides.
On 9 August 2023, eight water samples were collected from the Menindee Weir Pools in the Darling-Barka River (samples 1-8). The correlating sample identifications are given in brackets for reference to the full laboratory report data.
- Sample 1 (B1) (water only) – Lake Wetherell upstream of the Main Weir
- Sample 2 (B2) (sediment and water) – Outlet of Lake Pamamaroo into Darling River
- Sample 3 (E1) (sediment and water) – Upper weir pool
- Sample 4 (E2) (sediment and water) – Mid weir pool
- Sample 5 (E3) (sediment and water) – Menindee town
- Sample 6 (E4) (sediment and water) – Downstream Menindee town
- Sample 7 (E5) (sediment and water) – Lower weir pool downstream Lake Menindee inflow
- Sample 8 (B3) (sediment and water) – Outlet of Lake Menindee into Darling-Barka River
- Sample 21 (P1) (sediment only) – Downstream of Menindee Main Weir
- Sample 22 (P2) (sediment only) – Upstream of upper weir sample site/li>
- Sample 23 (P3) (sediment only) – Weir pool north of Menindee Hut Waterhole
- Sample 24 (P4) (sediment only) – Northeast of Orchard Rd upstream of mid weir pool sample site
- Sample 25 (P5) (sediment only) –Northeast of Menindee golf club downstream of mid weir pool site
- Sample 26 (P6) (sediment only) – Southeast of loop road
- Sample 27 (P7) (sediment only) – Downstream and close to the outlet of Lake Menindee into the Darling-Barka River
- Sample 28 (P8) (sediment only) – In between outlet of Lake Menindee and Lower Weir Pool site

More sampling
The DPE are conducting regular water quality monitoring on the Darling-Barka River from upstream of Menindee to Pooncarie as well as the Great Darling Anabranch. The test results from these samples will also be published on this website.
Through the Darling Barka River Health Project, DPE Science have installed four telemetered loggers which collect real-time data on water quality in the project area.
In-field measurements
At the time of sampling, the DPE collected in-field measurements for pH, dissolved oxygen, conductivity, temperature, and turbidity.
All parameters were within the expected ranges.
| Sample | Location | Temperature (°C) | Dissolved oxygen (mg/L) | Electrical conductivity (µS/cm) | pH | Turbidity (NTU) |
|---|---|---|---|---|---|---|
|
1 (B1) |
Lake Wetherell upstream of the Main Weir |
nm |
nm |
nm |
nm |
nm |
|
2 (B2) |
Outlet of Lake Pamamaroo into Darling River |
13.6 |
9.4 |
535 |
8.2 |
21.9 |
|
3 (E1) |
Upper weir pool |
13.6 |
9.0 |
551 |
8.2 |
23.7 |
|
4 (E2) |
Mid weir pool |
14.2 |
9.9 |
585 |
8.2 |
13.8 |
|
5 (E3) |
Menindee town |
14.4 |
9.4 |
579 |
8.2 |
13.3 |
|
6 (E4) |
Downstream Menindee town |
14.0 |
9.9 |
605 |
8.3 |
10.2 |
|
7 (E5) |
Lower weir pool downstream Lake Menindee inflow |
13.8 |
9.5 |
568 |
8.3 |
18.3 |
|
8 (B3) |
Outlet of Lake Menindee into Darling-Barka River |
12.8 |
6.1 |
334 |
7.9 |
40.3 |
nm = Not measured this round
Nitrogen, Phosphorus and Ammonia
Sample results show that total nitrogen and total phosphorous are higher than the acceptable levels given for lowland river ecosystems in NSW (ANZG 2018, which agree with the regionally specific set of guideline values for the Murray-Darling outlined in the Basin Plan 2012). Total nitrogen was detected at up to two times higher than the guideline value while total phosphorous was detected at up to seven times higher. Algal blooms are possible if these nutrients remain elevated.
Bacteria convert nitrogen compounds such as ammonia into nitrite and nitrate. These compounds can harm aquatic organisms. Ammonia was well below the Australian and New Zealand water quality guidelines for toxicity. While the levels would not be expected to be harmful to fish, the ammonia could promote growth in algae and macrophytes. The ammonia is likely to be from river sources including rotting fish and flood organic matter rather than diffuse inputs from surrounding land.
Algae
There were positive detections in all samples for blue-green algae. However, only the blue-green algae detections found in sample 3, 6 and 7 were considered potentially toxic.
Sediment Contaminants
Metals and pesticides were compared to ANZG (2018) default sediment quality guideline values (DGV) and high guideline values (GV-High).
The metals, with guidelines listed in ANZG (2018), had measured concentrations below all sediment quality guideline (DGV) threshold values except nickel. Nickel measured slightly higher than the DGV for some sites, but all these sites recorded well below the high guideline values (GV-High). This is suggesting there is a low risk of effects to the Darling-Barka aquatic ecosystem associated with post-flood deposition or localised inputs.
Sediment carbon contents (0.1 - 2.0%) were in the low to moderate range for riverine sediments and did not indicate excessive organic enrichment. Sediment carbon and nitrogen stable isotopes were measured to provide an indication of organic matter sources. Stable isotope values were not consistent with the accumulation of fish biomass, and in contrast suggested that main sources of organic matter to sediments was phytoplankton detritus and terrestrial organic matter.
A range of pesticides were analysed in the collected sediment samples. No pesticides were detected, therefore the risk posed by these contaminants is likely to be low, however, in some cases the detection limit exceeds the DGVs.
Download the full test results
References
ANZG (2018), Australian and New Zealand Guidelines for Fresh and Marine Water Quality, Australian and New Zealand Governments and Australian state and territory governments, Canberra ACT (Australian Capital Territory), Australia. Available at www.waterquality.gov.au/anz-guidelines
Basin Plan (2012), Schedule 11, Water Act 2007, Murray-Darling Basin Authority, Commonwealth of Australia
The Department of Planning and Environment (DPE) collected nineteen water samples between 1 to 3 August 2023 at Menindee along the Darling-Barka River, downstream along the lower Darling-Barka River, and along the Great Darling Anabranch.
Sampling was reduced during this period following direction to investigate further reported fish deaths. All samples were checked for ammonia, excess nitrogen and phosphorus. Samples from Menindee along the Darling-Barka River were also checked for pesticides, algae and algal toxins. Metals were unable to be reported on for this round due to a laboratory error. Future monitoring and reporting will include metals.
Pesticide and metal analyses have been completed routinely between March and July 2023 with no pesticide detections, and all metals except copper measuring below levels set to protect water life. Copper has consistently measured above the level set to protect water life in various samples across the regions, yet well below the level harmful to fish. For these reasons, both pesticides and metals analysis will continue on a less regular basis. All other routine analyses will continue at the same frequency.
One of the samples usually collected from the lower Darling-Barka region was unable to be sampled on this occasion, interrupted by road closures due to inclement weather.
Summary
Pesticides
Samples were scanned for more than 600 pesticides. None were detected.
Nitrogen and phosphorus
Nitrogen and phosphorous levels are high. If nitrogen and phosphorus stay high, they can cause algal blooms.
Algae and algal toxins
Blue-green algae were detected in all samples, but potentially toxic blue-green algae were detected in only two of the samples. The algal toxin Cylindrospermopsin was not detected in any of the samples.
Sample locations
Water was sampled between 1 and 3 August 2023 from nineteen locations on the Darling-Barka River at Menindee, downstream along the lower Darling-Barka River, and along the Great Darling Anabranch.
On 1 August 2023, eight samples were collected from the Menindee Weir Pools in the Darling-Barka River. The correlating sample identifications are given in brackets for reference to the full laboratory report data.
- Sample 1 (B1) – Lake Wetherell upstream of the Main Weir
- Sample 2 (B2) – Outlet of Lake Pamamaroo into Darling River
- Sample 3 (E1) – Upper weir pool
- Sample 4 (E2) – Mid weir pool
- Sample 5 (E3) – Menindee town
- Sample 6 (E4) – Downstream Menindee town
- Sample 7 (E5) – Lower weir pool downstream Lake Menindee inflow
- Sample 8 (B3) – Outlet of Lake Menindee into Darling-Barka River
On 2 August 2023, two samples were collected from the Great Darling Anabranch region.
- Sample 11 (E6.5) – Tandou Creek at Tandou Woolshed Rd (incorporating inflows from Kangaroo Lake)
- Sample 12 (E7) – Tandou Creek at Packers Crossing (incorporating inflows from Packers Lake)
On 3 August 2023, two samples were collected from the Great Darling Anabranch region and seven samples were collected from the Lower Darling-Barka River between Weir 32 and Pooncarie.
- Sample 9 (B4) – Lake Cawndilla outlet into the anabranch of Darling River
- Sample 10 (E6) – Redbank Creek upstream of Cawndilla Channel confluence
- Sample 13 (E8) – Kinchega National Park upper
- Sample 14 (E9) – Kinchega National Park mid (incorporating inflows from Emu Lake)
- Sample 16 (E11) – Bindara Station reach
- Sample 17 (E12) – Karoola Station reach
- Sample 18 (E13) – Coona Point reach
- Sample 19 (E14) – Mullingar Station reach
- Sample 20 (E15) – Old wharf at Pooncarie
Sample 15 (E10) Kinchega National Park lower was unable to be sampled on this occasion, due to accessibility issues following heavy rain.


More sampling
The DPE are conducting regular water quality monitoring on the Darling-Barka River from upstream of Menindee to Pooncarie as well as the Great Darling Anabranch. The test results from these samples will also be published on this website.
In-field measurements
At the time of sampling, the DPE collected in-field measurements for pH, dissolved oxygen, conductivity, temperature and turbidity.
pH was outside the guideline value for all samples in the Great Darling Anabranch region.
All other parameters were within the expected ranges.
| Sample | Location | Temp (°C) | Dissolved oxygen (mg/L) | Electrical conductivity (µS/cm) | pH | Turbidity (NTU) |
|---|---|---|---|---|---|---|
|
1 (B1) |
Lake Wetherell upstream of the Main Weir |
13.6 |
6.8 |
624 |
7.9 |
7.5 |
|
2 (B2) |
Outlet of Lake Pamamaroo into Darling River |
13.8 |
9.1 |
570 |
8.0 |
23.6 |
|
3 (E1) |
Upper weir pool |
14.2 |
9.6 |
600 |
8.2 |
16.6 |
|
4 (E2) |
Mid weir pool |
13.8 |
9.9 |
556 |
8.2 |
14.2 |
|
5 (E3) |
Menindee town |
13.9 |
11.3 |
636 |
8.4 |
8.3 |
|
6 (E4) |
Downstream Menindee town |
14.6 |
11.3 |
689 |
8.4 |
7.0 |
|
7 (E5) |
Lower weir pool downstream Lake Menindee inflow |
13.5 |
10.3 |
589 |
8.3 |
18.3 |
|
8 (B3) |
Outlet of Lake Menindee into Darling-Barka River |
16.5 |
6.7 |
362 |
7.9 |
43.5 |
|
9 (B4) |
Lake Cawndilla outlet into the anabranch of Darling River |
15.0 |
10.4 |
377 |
8.5 |
13.8 |
|
10 (E6) |
Redbank Creek upstream of Cawndilla Channel confluence |
15.5 |
16.1 |
349 |
9.5 |
14.6 |
|
11 (E6.5) |
Tandou Creek at Tandou Woolshed Rd (incorporating inflows from Kangaroo Lake) |
16.4 |
14.1 |
404 |
9.1 |
30.1 |
|
12 (E7) |
Tandou Creek at Packers Crossing (incorporating inflows from Packers Lake) |
16.5 |
13.4 |
428 |
9.2 |
31.7 |
|
13 (E8) |
Kinchega National Park upper |
12.8 |
9.1 |
580 |
8.1 |
19.2 |
|
14 (E9) |
Kinchega National Park mid (incorporating inflows from Emu Lake) |
12.7 |
10.0 |
571 |
8.1 |
21.4 |
|
16 (E11) |
Bindara Station reach |
14.0 |
10.7 |
494 |
8.2 |
36.9 |
|
17 (E12) |
Karoola Station reach |
12.8 |
8.5 |
519 |
7.9 |
35.3 |
|
18 (E13) |
Coona Point reach |
12.9 |
10.4 |
495 |
8.1 |
32.9 |
|
19 (E14) |
Mullingar Station reach |
13.0 |
10.0 |
471 |
8.1 |
44.8 |
|
20 (E15) |
Old wharf at Pooncarie |
12.0 |
9.5 |
436 |
8.0 |
43.5 |
Nitrogen, phosphorus and ammonia
Sample results show that total nitrogen and total phosphorous are higher than the acceptable levels given for lowland river ecosystems in NSW (ANZG 2018, which are in agreement with the regionally specific set of guideline values for the Murray-Darling outlined in the Basin Plan 2012). Total nitrogen was detected at up to five times higher than the guideline value while total phosphorous was detected at up to eight times higher, with the exception of Sample 12 which was twelve times higher. Algal blooms are possible if these nutrients remain elevated.
Bacteria convert nitrogen compounds such as ammonia into nitrite and nitrate. These compounds can harm aquatic organisms. Ammonia was well below the Australian and New Zealand water quality guidelines for toxicity. While the levels would not be expected to be harmful to fish, the ammonia could promote growth in algae and macrophytes. The ammonia is likely to be from river sources including rotting fish and flood organic matter rather than diffuse inputs from surrounding land.
Algae and algal toxins
There were positive detections in all samples for blue-green algae in the Menindee region. However, only the blue-green algae detections found in samples 3 and 8 were considered potentially toxic. The algal toxin Cylindrospermopsin was not detected in any samples from this region.
The algae levels detected fall within the ‘amber’ to ‘red’ alert levels. A red alert is in place along parts of the lower Darling-Barka River.
A red alert and amber alert is in place along at Menindee and further downstream, as of 3 November 2023. See WaterNSW for information about alerts.
Pesticides
As noted above, a pesticide screening test that scanned for over 600 pesticides was completed for samples from the Menindee region. All samples came back negative for pesticide detection.
Metals
Metals were unable to be reported on for this round due to a laboratory processing error. Future monitoring and reporting will include metals.
Download the full test results
References
ANZG (2018), Australian and New Zealand Guidelines for Fresh and Marine Water Quality, Australian and New Zealand Governments and Australian state and territory governments, Canberra ACT, Australia. Available at www.waterquality.gov.au/anz-guidelines
Basin Plan (2012), Schedule 11, Water Act 2007, Murray-Darling Basin Authority, Commonwealth of Australia
The Department of Planning and Environment (DPE) collected eight water samples on 25 and 26 July 2023 at Menindee along the Darling-Barka River.
Samples were checked for pesticides, excess nitrogen and phosphorus, ammonia, algae and algal toxins. Metals were unable to be reported on for this round due to a laboratory error.
Routine sampling for this round was interrupted by road closures due to inclement weather. As a result, the additional twelve samples usually collected from the Great Darling Anabranch and lower Darling-Barka River were not able to be collected.
Summary
Pesticides
Samples were scanned for more than 600 pesticides. None were detected.
Nitrogen and phosphorus
Nitrogen and phosphorous levels are high. If nitrogen and phosphorus stay high they can cause algal blooms.
Algae and algal toxins
Blue-green algae were detected in all samples, but potentially toxic blue-green algae were detected in only two of the samples. The algal toxin Cylindrospermopsin was not detected in any of the samples.
Sample locations
On 25 July 2023, eight samples were collected from the Menindee Weir Pools in the Darling-Barka River. The correlating sample identifications are given in brackets for reference to the full laboratory report data.
- Sample 1 (B1) – Lake Wetherell upstream of the Main Weir
- Sample 2 (B2) – Outlet of Lake Pamamaroo into Darling River
- Sample 3 (E1) – Upper weir pool
- Sample 4 (E2) – Mid weir pool
- Sample 5 (E3) – Menindee town
- Sample 6 (E4) – Downstream Menindee town
- Sample 7 (E5) – Lower weir pool downstream Lake Menindee inflow
- Sample 8 (B3) – Outlet of Lake Menindee into Darling-Barka River

More sampling
The DPE are conducting regular water quality monitoring on the Darling-Barka River from upstream of Menindee to Pooncarie as well as the Great Darling Anabranch. The test results from these samples will also be published on this website.
In-field measurements
At the time of sampling, the DPE collected in-field measurements for pH, dissolved oxygen, conductivity, temperature and turbidity.
All parameters were within the expected ranges.
| Sample | Location | Temp (°C) | Dissolved oxygen (mg/L) | Electrical conductivity (µS/cm) | pH | Turbidity (NTU) |
|---|---|---|---|---|---|---|
|
1 (B1) |
Lake Wetherell upstream of the Main Weir |
12.6 |
9.6 |
635 |
8.5 |
8.4 |
|
2 (B2) |
Outlet of Lake Pamamaroo into Darling River |
11.9 |
10.4 |
509 |
8.5 |
20.6 |
|
3 (E1) |
Upper weir pool |
12.2 |
9.7 |
575 |
8.4 |
19.9 |
|
4 (E2) |
Mid weir pool |
12.3 |
10.2 |
580 |
8.4 |
12.8 |
|
5 (E3) |
Menindee town |
12.5 |
10.8 |
643 |
8.5 |
11.3 |
|
6 (E4) |
Downstream Menindee town |
12.9 |
10.2 |
629 |
8.4 |
11.8 |
|
7 (E5) |
Lower weir pool downstream Lake Menindee inflow |
12.2 |
10.3 |
506 |
8.4 |
19.7 |
|
8 (B3) |
Outlet of Lake Menindee into Darling-Barka River |
12.0 |
4.8 |
327 |
7.9 |
42.1 |
Nitrogen, phosphorus and ammonia
Sample results show that total nitrogen and total phosphorous are higher than the acceptable levels given for lowland river ecosystems in NSW (ANZG 2018, which are in agreement with the regionally specific set of guideline values for the Murray-Darling outlined in the Basin Plan 2012). Total nitrogen was detected at up to two times higher than the guideline value while total phosphorous was detected at up to four times higher, with the exception of Sample 8 which was seven times higher. Algal blooms are possible if these nutrients remain elevated.
Bacteria convert nitrogen compounds such as ammonia into nitrite and nitrate. These compounds can harm aquatic organisms. Ammonia was well below the Australian and New Zealand water quality guidelines for toxicity. While the levels would not be expected to be harmful to fish, the ammonia could promote growth in algae and macrophytes. The ammonia is likely to be from river sources including rotting fish and flood organic matter rather than diffuse inputs from surrounding land.
Algae and algal toxins
There were positive detections in all samples for blue-green algae. However, only the blue-green algae detections found in samples 5 and 6 were considered potentially toxic. The algal toxin Cylindrospermopsin was not detected in any samples from this region.
Pesticides
As noted above, a pesticide screening test that scanned for over 600 pesticides was completed. All samples came back negative for pesticide detection.
Download the full test results
References
ANZG (2018), Australian and New Zealand Guidelines for Fresh and Marine Water Quality, Australian and New Zealand Governments and Australian state and territory governments, Canberra ACT, Australia. Available at www.waterquality.gov.au/anz-guidelines
Basin Plan (2012), Schedule 11, Water Act 2007, Murray-Darling Basin Authority, Commonwealth of Australia
The Department of Planning and Environment (DPE) and the NSW Environment Protection Authority (EPA) collected eight water samples on 27 June 2023 at Menindee along the Darling-Barka River.
Samples were checked for pesticides, excess nitrogen and phosphorus, ammonia, metals, algae and algal toxins.
Routine sampling for this round was interrupted by road closures due to inclement weather. As a result, the additional twelve samples usually collected from the Great Darling Anabranch and lower Darling-Barka River were not able to be collected.
Summary
Pesticides
Samples were scanned for more than 600 pesticides. None were detected.
Nitrogen and phosphorus
Nitrogen and phosphorous levels are high. If nitrogen and phosphorus stay high they can cause algal blooms.
Algae and algal toxins
Blue-green algae were detected in all samples, but potentially toxic blue-green algae were detected in three of the samples. The algal toxin Cylindrospermopsin was not detected in any of the samples.
An ‘amber alert’ is in place along at Menindee and further downstream, as of 25 July 2023. See WaterNSW for information about alerts
Metals
Copper was slightly above the level set to protect water life in four samples, but well below the level harmful to fish. All other metals were under the levels set to protect water life.
Sample locations
On 27 June 2023, eight samples were collected from the Menindee Weir Pools in the Darling-Barka River. The correlating sample identifications are given in brackets for reference to the full laboratory report data.
- Sample 1 (B1) – Lake Wetherell upstream of the Main Weir
- Sample 2 (B2) – Outlet of Lake Pamamaroo into Darling River
- Sample 3 (E1) – Upper weir pool
- Sample 4 (E2) – Mid weir pool
- Sample 5 (E3) – Menindee town
- Sample 6 (E4) – Downstream Menindee town
- Sample 7 (E5) – Lower weir pool downstream Lake Menindee inflow
- Sample 8 (B3) – Outlet of Lake Menindee into Darling-Barka River

More sampling
The DPE and EPA are conducting regular water quality monitoring on the Darling-Barka River from upstream of Menindee to Pooncarie as well as the Great Darling Anabranch. The test results from these samples will also be published on this website.
In-field measurements
At the time of sampling, the EPA collected in-field measurements for pH, dissolved oxygen, conductivity, temperature and turbidity.
All parameters were within the expected ranges.
|
Sample |
Location |
Temp (°C) |
Dissolved oxygen (mg/L) |
Electrical conductivity (µS/cm) |
pH |
Turbidity (NTU) |
|---|---|---|---|---|---|---|
|
1 (B1) |
Lake Wetherell upstream of the Main Weir |
12.2 |
11.6 |
606 |
8.5 |
7.3 |
|
2 (B2) |
Outlet of Lake Pamamaroo into Darling River |
11.5 |
7.9 |
586 |
8.1 |
10.5 |
|
3 (E1) |
Upper weir pool |
11.3 |
10.0 |
586 |
8.3 |
12.1 |
|
4 (E2) |
Mid weir pool |
11.6 |
9.7 |
568 |
8.2 |
11.7 |
|
5 (E3) |
Menindee town |
11.7 |
7.3 |
470 |
8.0 |
19.2 |
|
6 (E4) |
Downstream Menindee town |
11.7 |
6.2 |
458 |
7.9 |
26.1 |
|
7 (E5) |
Lower weir pool downstream Lake Menindee inflow |
11.5 |
8.9 |
422 |
8.2 |
32.0 |
|
8 (B3) |
Outlet of Lake Menindee into Darling-Barka River |
10.4 |
10.8 |
306 |
8.4 |
62.4 |
Nitrogen, phosphorus and ammonia
Sample results show that total nitrogen and total phosphorous are higher than the acceptable levels given for lowland river ecosystems in NSW (ANZG 2018, which are in agreement with the regionally specific set of guideline values for the Murray-Darling outlined in the Basin Plan 2012). Total nitrogen was detected at up to three times higher than the guideline value while total phosphorous was detected at up to eight times higher. Algal blooms are possible if these nutrients remain elevated.
Bacteria convert nitrogen compounds such as ammonia into nitrite and nitrate. These compounds can harm aquatic organisms. Ammonia was well below the Australian and New Zealand water quality guidelines for toxicity. While the levels would not be expected to be harmful to fish, the ammonia could promote growth in algae and macrophytes. The ammonia is likely to be from river sources including rotting fish and flood organic matter rather than diffuse inputs from surrounding land.
Algae and algal toxins
There were positive detections in all samples for blue-green algae. However, only the blue-green algae detections found in sample 2, 3 and 6 were considered potentially toxic. The algal toxin Cylindrospermopsin was not detected in any samples from this region.
The algae levels detected fall within the ‘amber’ alert levels. An ‘amber alert’ is in place at Menindee and further downstream, as of 25 July 2023.
Pesticides
As noted above, a pesticide screening test that scanned for over 600 pesticides was completed for all samples. All samples came back negative for pesticide detection.
Metals
Many metals are vital for humans and animals to stay healthy and only pose a risk if they are found at high levels in the environment. Concentrations of key metals found in water are below.
Total metals have been compared to recreational water quality guidelines and dissolved metals have been compared to ecological water quality guidelines as per the National Health and Medical Research Council (NHMRC) recreational and Australian and New Zealand Water Quality (ANZG) guidelines, respectively.
Total metals provide a more conservative estimate of exposure from recreational use whereas dissolved metals are used for ecological assessments as this is the bioavailable fraction of the metal (the part that is toxic to organisms).
|
Metal in Water |
NHMRC (2008)2 |
Samples from the Menindee Weir Pools along the Darling-Barka River (total acid-extractable metals) |
|||||||
|---|---|---|---|---|---|---|---|---|---|
|
Recreational Water Guidelines |
1 |
2 |
3 |
4 |
5 |
6 |
7 |
8 |
|
|
(mg/L) |
(mg/L) |
(mg/L) |
(mg/L) |
(mg/L) |
(mg/L) |
(mg/L) |
(mg/L) |
(mg/L) |
|
|
Aluminium |
No value |
0.54 |
1.1 |
1.1 |
1.2 |
2.1 |
1.8 |
3.4 |
6.6 |
|
Arsenic |
0.07 |
0.001 |
0.002 |
0.002 |
0.002 |
0.003 |
0.003 |
0.004 |
0.007 |
|
Chromium |
0.5 |
<0.001 |
0.001 |
0.001 |
0.001 |
0.002 |
0.002 |
0.003 |
0.006 |
|
Cobalt |
No value |
0.0007 |
0.0009 |
0.0010 |
0.0010 |
0.0012 |
0.0011 |
0.0012 |
0.0016 |
|
Copper |
20 |
0.0016 |
0.0020 |
0.0020 |
0.0020 |
0.0029 |
0.0028 |
0.0037 |
0.0058 |
|
Lead |
0.1 |
0.0004 |
0.0005 |
0.0007 |
0.0006 |
0.0008 |
0.0008 |
0.0009 |
0.0013 |
|
Nickel |
0.2 |
0.0033 |
0.0036 |
0.0035 |
0.0036 |
0.0044 |
0.0045 |
0.0050 |
0.0061 |
|
Zinc |
30 |
0.002 |
0.002 |
0.002 |
0.002 |
0.005 |
0.004 |
0.006 |
0.010 |
2NHMRC (2008) Guidelines for managing risks in recreational waters (10 x drinking water guideline value, Table 9.3)
|
Metal in Water |
ANZG 20183 |
Samples from the Menindee Weir Pools along the Darling-Barka River (dissolved metals) |
|||||||
|---|---|---|---|---|---|---|---|---|---|
|
Water Quality Guideline for aquatic ecosystems (95% species protection) |
1 |
2 |
3 |
4 |
5 |
6 |
7 |
8 |
|
|
(mg/L) |
(mg/L) |
(mg/L) |
(mg/L) |
(mg/L) |
(mg/L) |
(mg/L) |
(mg/L) |
(mg/L) |
|
|
Aluminium |
0.055 |
<0.04 |
<0.04 |
<0.04 |
<0.04 |
<0.04 |
<0.04 |
<0.04 |
<0.04 |
|
Arsenic |
0.013 |
0.001 |
0.002 |
0.001 |
0.001 |
0.002 |
0.003 |
0.004 |
0.006 |
|
Cadmium |
0.0002 |
<0.0001 |
<0.0001 |
<0.0001 |
<0.0001 |
<0.0001 |
<0.0001 |
<0.0001 |
<0.0001 |
|
Chromium |
0.001 |
<0.001 |
<0.001 |
<0.001 |
<0.001 |
<0.001 |
<0.001 |
<0.001 |
<0.001 |
|
Cobalt |
No value |
0.0002 |
0.0002 |
0.0002 |
0.0002 |
0.0002 |
0.0002 |
0.0002 |
0.0001 |
|
Copper |
0.0014 |
0.0012 |
0.0012 |
0.0012 |
0.0012 |
0.0017 |
0.0016 |
0.0020 |
0.0029 |
|
Lead |
0.0034 |
<0.0001 |
<0.0001 |
<0.0001 |
<0.0001 |
<0.0001 |
<0.0001 |
<0.0001 |
<0.0001 |
|
Manganese |
1.9 |
<0.001 |
<0.001 |
<0.001 |
<0.001 |
<0.001 |
<0.001 |
<0.001 |
<0.001 |
|
Nickel |
0.011 |
0.0024 |
0.0026 |
0.0026 |
0.0027 |
0.0032 |
0.0031 |
0.0025 |
0.0022 |
|
Selenium |
0.005 |
<0.005 |
<0.005 |
<0.005 |
<0.005 |
<0.005 |
<0.005 |
<0.005 |
<0.005 |
|
Silver |
0.0005 |
<0.0001 |
<0.0001 |
<0.0001 |
<0.0001 |
<0.0001 |
<0.0001 |
<0.0001 |
<0.0001 |
|
Zinc |
0.008 |
0.002 |
<0.001 |
<0.001 |
<0.001 |
<0.001 |
<0.001 |
<0.001 |
<0.001 |
3ANZG (2018). Australian and New Zealand Guidelines for Fresh and Marine Water Quality. Australian and New Zealand Governments and Australian state and territory governments, Canberra ACT, Australia.
References
ANZG (2018), Australian and New Zealand Guidelines for Fresh and Marine Water Quality, Australian and New Zealand Governments and Australian state and territory governments, Canberra ACT, Australia. Available at www.waterquality.gov.au/anz-guidelines
Basin Plan (2012), Schedule 11, Water Act 2007, Murray-Darling Basin Authority, Commonwealth of Australia
NHMRC (2008), Guidelines for managing risks in recreational waters, Australian Government National Health and Medical Research Council
Download the full test results
27 June results
- Report for metals and pesticides – 27 June, Menindee weir pools (PDF 172KB)
- Report for algal toxins – 27 June, Menindee weir pools (PDF 186KB)
- Report for algal identification and cell count – 27 June, Menindee weir pools (PDF 215KB)
- Report for nutrients, glyphosate and phenoxyherbicides – 27 June, Menindee weir pools (PDF 709KB)
The Department of Planning and Environment (DPE) and the NSW Environment Protection Authority (EPA) collected nineteen water samples between 20 to 22 June 2023 at Menindee along the Darling-Barka River, downstream along the lower Darling-Barka River, and along the Great Darling Anabranch.
Samples were checked for pesticides, excess nitrogen and phosphorus, ammonia, metals, algae and algal toxins.
One of the samples usually collected from the lower Darling-Barka region was unable to be sampled on this occasion, due to accessibility issues following heavy rain.
Summary
Pesticides
Samples were scanned for more than 600 pesticides. None were detected.
Nitrogen and phosphorus
Nitrogen and phosphorous levels are high. If nitrogen and phosphorus stay high they can cause algal blooms.
Algae and algal toxins
Blue-green algae were detected in all samples, but potentially toxic blue-green algae were detected in thirteen of the samples. The algal toxin Cylindrospermopsin was detected in nine samples across all regions.
A ‘red alert’ is in place along parts of the lower Darling-Barka River. An ‘amber alert’ is in place along the Great Darling Anabranch and along the Darling-Barka River, at Menindee and further downstream, as of 31 July 2023. See WaterNSW for information about red alerts
Metals
Copper was slightly above the level set to protect water life in most samples across all 3 regions, but well below the level harmful to fish. All other metals were under the levels set to protect water life.
Sample locations
Water was sampled between 20 to 22 June 2023 from nineteen locations on the Darling-Barka River at Menindee, downstream along the lower Darling-Barka River, and along the Great Darling Anabranch.
On 20 June 2023, eight samples were collected from the Menindee Weir Pools in the Darling-Barka River. The correlating sample identifications are given in brackets for reference to the full laboratory report data.
- Sample 1 (B1) – Lake Wetherell upstream of the Main Weir
- Sample 2 (B2) – Outlet of Lake Pamamaroo into Darling River
- Sample 3 (E1) – Upper weir pool
- Sample 4 (E2) – Mid weir pool
- Sample 5 (E3) – Menindee town
- Sample 6 (E4) – Downstream Menindee town
- Sample 7 (E5) – Lower weir pool downstream Lake Menindee inflow
- Sample 8 (B3) – Outlet of Lake Menindee into Darling-Barka River
On 21 June 2023, four samples were collected from the Great Darling Anabranch region and four samples from the Lower Darling-Barka River between Weir 32 and Pooncarie.
- Sample 9 (B4) – Lake Cawndilla outlet into the anabranch of Darling River
- Sample 10 (E6) – Redbank Creek upstream of Cawndilla Channel confluence
- Sample 11 (E6.5) – Tandou Creek at Tandou Woolshed Rd (incorporating inflows from Kangaroo Lake)
- Sample 12 (E7) – Tandou Creek at Packers Crossing (incorporating inflows from Packers Lake)
- Sample 13 (E8) – Kinchega National Park upper
- Sample 14 (E9) – Kinchega National Park mid (incorporating inflows from Emu Lake)
- Sample 15 (E10) – Kinchega National Park lower (upstream of Anabranch offtake)
- Sample 16 (E11) – Bindara Station reach
On 22 June 2023, three samples were collected from the Lower Darling-Barka River between Weir 32 and Pooncarie.
- Sample 17 (E12) – Karoola Station reach
- Sample 19 (E14) – Mullingar Station reach
- Sample 20 (E15) – Old wharf at Pooncarie
Sample 18 (E13) “Coona Point reach” was unable to be sampled on this occasion, due to accessibility issues following heavy rain.


More sampling
The DPE and EPA are conducting regular water quality monitoring on the Darling-Barka River from upstream of Menindee to Pooncarie as well as the Great Darling Anabranch. The test results from these samples will also be published on this website.
In-field measurements
At the time of sampling, the EPA collected in-field measurements for pH, dissolved oxygen, conductivity, temperature and turbidity.
pH was outside the guideline value for all samples in the Great Darling Anabranch region.
All other parameters were within the expected ranges.
|
Sample |
Location |
Temp (°C) |
Dissolved oxygen (mg/L) |
Electrical conductivity (µS/cm) |
pH |
Turbidity (NTU) |
|---|---|---|---|---|---|---|
|
1 (B1) |
Lake Wetherell upstream of the Main Weir |
12.9 |
9.7 |
586 |
8.5 |
9.3 |
|
2 (B2) |
Outlet of Lake Pamamaroo into Darling River |
12.8 |
9.9 |
586 |
8.3 |
12.2 |
|
3 (E1) |
Upper weir pool |
12.7 |
9.2 |
556 |
8.2 |
13.2 |
|
4 (E2) |
Mid weir pool |
12.9 |
9.0 |
442 |
8.2 |
24.2 |
|
5 (E3) |
Menindee town |
13.1 |
7.9 |
433 |
8.1 |
29.0 |
|
6 (E4) |
Downstream Menindee town |
13.0 |
5.6 |
396 |
7.8 |
35.4 |
|
7 (E5) |
Lower weir pool downstream Lake Menindee inflow |
12.9 |
8.7 |
368 |
8.1 |
46.9 |
|
8 (B3) |
Outlet of Lake Menindee into Darling-Barka River |
11.8 |
10.4 |
317 |
8.4 |
62.5 |
|
9 (B4) |
Lake Cawndilla outlet into the anabranch of Darling River |
12.3 |
10.2 |
347 |
8.6 |
19.8 |
|
10 (E6) |
Redbank Creek upstream of Cawndilla Channel confluence |
10.6 |
12.6 |
334 |
9.0 |
24.5 |
|
11 (E6.5) |
Tandou Creek at Tandou Woolshed Rd (incorporating inflows from Kangaroo Lake) |
9.7 |
13.2 |
345 |
9.3 |
25.0 |
|
12 (E7) |
Tandou Creek at Packers Crossing (incorporating inflows from Packers Lake) |
11.3 |
9.6 |
343 |
8.8 |
37.6 |
|
13 (E8) |
Kinchega National Park upper |
12.2 |
8.6 |
365 |
8.0 |
44.7 |
|
14 (E9) |
Kinchega National Park mid (incorporating inflows from Emu Lake) |
11.7 |
9.1 |
360 |
8.1 |
48.8 |
|
15 (E10) |
Kinchega National Park lower (upstream of Anabranch offtake) |
11.2 |
9.4 |
367 |
8.2 |
45.0 |
|
16 (E11) |
Bindara Station reach |
11.2 |
10.0 |
369 |
8.2 |
43.2 |
|
17 (E12) |
Karoola Station reach |
10.9 |
9.3 |
368 |
8.0 |
42.4 |
|
19 (E14) |
Mullingar Station reach |
10.7 |
9.7 |
363 |
8.0 |
59.0 |
|
20 (E15) |
Old wharf at Pooncarie |
10.9 |
8.8 |
369 |
7.9 |
57.2 |
Nitrogen, phosphorus and ammonia
Sample results show that total nitrogen and total phosphorous are higher than the acceptable levels given for lowland river ecosystems in NSW (ANZG 2018, which are in agreement with the regionally specific set of guideline values for the Murray-Darling outlined in the Basin Plan 2012). Total nitrogen was detected at up to four times higher than the guideline value while total phosphorous was detected at up to seven times higher. Algal blooms are possible if these nutrients remain elevated.
Bacteria convert nitrogen compounds such as ammonia into nitrite and nitrate. These compounds can harm aquatic organisms. Ammonia was well below the Australian and New Zealand water quality guidelines for toxicity. While the levels would not be expected to be harmful to fish, the ammonia could promote growth in algae and macrophytes. The ammonia is likely to be from river sources including rotting fish and flood organic matter rather than diffuse inputs from surrounding land.
Algae and algal toxins
There were positive detections in all samples for blue-green algae. However, only the blue-green algae detections found in samples 1, 2, 3, 9 to 12, 14 to 17, 19 and 20 were considered potentially toxic. The algal toxin Cylindrospermopsin was detected in samples 10 to 12, 14 to 17, 19 and 20.
The algae levels detected fall within the ‘amber’ to ‘red’ alert levels. A ‘red alert’ is in place along parts of the lower Darling-Barka River. An ‘amber alert’ is in place along the Great Darling Anabranch and along the Darling-Barka River, at Menindee and further downstream, as of 31 July 2023.
Pesticides
As noted above, a pesticide screening test that scanned for over 600 pesticides was completed for samples from all three regions. All samples came back negative for pesticide detection.
Metals
Many metals are vital for humans and animals to stay healthy and only pose a risk if they are found at high levels in the environment. Concentrations of key metals found in water are below.
Total metals have been compared to recreational water quality guidelines and dissolved metals have been compared to ecological water quality guidelines as per the National Health and Medical Research Council (NHMRC) recreational and Australian and New Zealand Water Quality (ANZG) guidelines, respectively.
Total metals provide a more conservative estimate of exposure from recreational use whereas dissolved metals are used for ecological assessments as this is the bioavailable fraction of the metal (the part that is toxic to organisms).
|
Metal in Water |
NHMRC (2008)2 |
Samples from the Menindee Weir Pools along the Darling-Barka River (total acid-extractable metals) |
|||||||
|---|---|---|---|---|---|---|---|---|---|
|
Recreational Water Guidelines |
1 |
2 |
3 |
4 |
5 |
6 |
7 |
8 |
|
|
(mg/L) |
(mg/L) |
(mg/L) |
(mg/L) |
(mg/L) |
(mg/L) |
(mg/L) |
(mg/L) |
(mg/L) |
|
|
Aluminium |
No value |
0.85 |
1.1 |
1.4 |
2.2 |
2.9 |
3.7 |
3.1 |
6.1 |
|
Arsenic |
0.07 |
0.002 |
0.002 |
0.002 |
0.003 |
0.003 |
0.004 |
0.004 |
0.006 |
|
Chromium |
0.5 |
<0.001 |
0.001 |
0.001 |
0.002 |
0.003 |
0.004 |
0.003 |
0.005 |
|
Cobalt |
No value |
0.0009 |
0.0011 |
0.0012 |
0.0012 |
0.0014 |
0.0016 |
0.0012 |
0.0015 |
|
Copper |
20 |
0.0017 |
0.0021 |
0.0021 |
0.0032 |
0.0035 |
0.0039 |
0.0047 |
0.0054 |
|
Lead |
0.1 |
0.0005 |
0.0006 |
0.0006 |
0.0008 |
0.0009 |
0.0011 |
0.0010 |
0.0012 |
|
Nickel |
0.2 |
0.0034 |
0.0036 |
0.0036 |
0.0047 |
0.0050 |
0.0059 |
0.0049 |
0.0058 |
|
Zinc |
30 |
0.003 |
0.003 |
0.003 |
0.004 |
0.005 |
0.006 |
0.006 |
0.018 |
2NHMRC (2008) Guidelines for managing risks in recreational waters (10 x drinking water guideline value, Table 9.3)
|
Metal in Water |
NHMRC (2008)2 |
Samples from the Great Darling Anabranch region (total acid-extractable metals) |
|||
|---|---|---|---|---|---|
|
Recreational Water Guidelines |
9 |
10 |
11 |
12 |
|
|
(mg/L) |
(mg/L) |
(mg/L) |
(mg/L) |
(mg/L) |
|
|
Aluminium |
No value |
2.4 |
2.5 |
3.1 |
4.0 |
|
Arsenic |
0.07 |
0.006 |
0.003 |
0.007 |
0.007 |
|
Chromium |
0.5 |
0.002 |
0.002 |
0.003 |
0.004 |
|
Cobalt |
No value |
0.0007 |
0.0011 |
0.0013 |
0.0020 |
|
Copper |
20 |
0.0041 |
0.0030 |
0.0042 |
0.0042 |
|
Lead |
0.1 |
0.0004 |
0.0006 |
0.0009 |
0.0012 |
|
Nickel |
0.2 |
0.0039 |
0.0040 |
0.0043 |
0.0052 |
|
Zinc |
30 |
0.005 |
0.004 |
0.010 |
0.007 |
2NHMRC (2008) Guidelines for managing risks in recreational waters (10 x drinking water guideline value, Table 9.3)
|
Metal in Water |
NHMRC (2008)2 |
Samples from the lower Darling-Barka River between Weir 32 and Pooncarie (total acid-extractable metals) |
||||||
|---|---|---|---|---|---|---|---|---|
|
Recreational Water Guidelines |
13 |
14 |
15 |
16 |
17 |
19 |
20 |
|
|
(mg/L) |
(mg/L) |
(mg/L) |
(mg/L) |
(mg/L) |
(mg/L) |
(mg/L) |
(mg/L) |
|
|
Aluminium |
No value |
4.8 |
5.3 |
4.7 |
4.2 |
3.9 |
6.7 |
7.3 |
|
Arsenic |
0.07 |
0.004 |
0.005 |
0.005 |
0.005 |
0.005 |
0.005 |
0.005 |
|
Chromium |
0.5 |
0.004 |
0.005 |
0.005 |
0.004 |
0.004 |
0.006 |
0.006 |
|
Cobalt |
No value |
0.0016 |
0.0019 |
0.0021 |
0.0020 |
0.0019 |
0.00224 |
0.0025 |
|
Copper |
20 |
0.0048 |
0.0051 |
0.0047 |
0.0046 |
0.0043 |
0.0053 |
0.0056 |
|
Lead |
0.1 |
0.0011 |
0.0013 |
0.0011 |
0.0011 |
0.0010 |
0.0015 |
0.0016 |
|
Nickel |
0.2 |
0.0059 |
0.0067 |
0.0068 |
0.0064 |
0.0064 |
0.0075 |
0.0079 |
|
Zinc |
30 |
0.008 |
0.009 |
0.007 |
0.007 |
0.007 |
0.010 |
0.011 |
2NHMRC (2008) Guidelines for managing risks in recreational waters (10 x drinking water guideline value, Table 9.3)
|
Metal in Water |
ANZG 20183 |
Samples from the Menindee Weir Pools along the Darling-Barka River (dissolved metals) |
|||||||
|---|---|---|---|---|---|---|---|---|---|
|
Water Quality Guideline for aquatic ecosystems (95% species protection) |
1 |
2 |
3 |
4 |
5 |
6 |
7 |
8 |
|
|
(mg/L) |
(mg/L) |
(mg/L) |
(mg/L) |
(mg/L) |
(mg/L) |
(mg/L) |
(mg/L) |
(mg/L) |
|
|
Aluminium |
0.055 |
<0.04 |
<0.04 |
<0.04 |
<0.04 |
<0.04 |
<0.04 |
<0.04 |
<0.04 |
|
Arsenic |
0.013 |
0.001 |
0.001 |
0.002 |
0.003 |
0.003 |
0.003 |
0.004 |
0.006 |
|
Cadmium |
0.0002 |
<0.0001 |
<0.0001 |
<0.0001 |
<0.0001 |
<0.0001 |
<0.0001 |
<0.0001 |
<0.0001 |
|
Chromium |
0.001 |
<0.001 |
<0.001 |
<0.001 |
<0.001 |
<0.001 |
<0.001 |
<0.001 |
<0.001 |
|
Cobalt |
No value |
0.0002 |
0.0002 |
0.0002 |
0.0002 |
0.0002 |
0.0002 |
0.0002 |
<0.0001 |
|
Copper |
0.0014 |
0.0010 |
0.0011 |
0.0012 |
0.0019 |
0.0018 |
0.0020 |
0.0024 |
0.0029 |
|
Lead |
0.0034 |
<0.0001 |
<0.0001 |
<0.0001 |
<0.0001 |
<0.0001 |
<0.0001 |
<0.0001 |
<0.0001 |
|
Manganese |
1.9 |
<0.001 |
<0.001 |
<0.001 |
<0.001 |
<0.001 |
<0.001 |
<0.001 |
<0.001 |
|
Nickel |
0.011 |
0.0024 |
0.0025 |
0.0026 |
0.0032 |
0.0032 |
0.0033 |
0.0030 |
0.0023 |
|
Selenium |
0.005 |
<0.005 |
<0.005 |
<0.005 |
<0.005 |
<0.005 |
<0.005 |
<0.005 |
<0.005 |
|
Silver |
0.0005 |
<0.0001 |
<0.0001 |
<0.0001 |
<0.0001 |
<0.0001 |
<0.0001 |
<0.0001 |
<0.0001 |
|
Zinc |
0.008 |
<0.001 |
<0.001 |
<0.001 |
<0.001 |
<0.001 |
<0.001 |
<0.001 |
<0.001 |
3ANZG (2018). Australian and New Zealand Guidelines for Fresh and Marine Water Quality. Australian and New Zealand Governments and Australian state and territory governments, Canberra ACT, Australia.
|
Metal in Water |
ANZG 20183 |
Samples from the Great Darling Anabranch region (dissolved metals) |
|||
|---|---|---|---|---|---|
|
Water Quality Guideline for aquatic ecosystems (95% species protection) |
9 |
10 |
11 |
12 |
|
|
(mg/L) |
(mg/L) |
(mg/L) |
(mg/L) |
(mg/L) |
|
|
Aluminium |
0.055 |
<0.04 |
<0.04 |
<0.04 |
<0.04 |
|
Arsenic |
0.013 |
0.006 |
0.003 |
0.007 |
0.007 |
|
Cadmium |
0.0002 |
<0.0001 |
<0.0001 |
<0.0001 |
<0.0001 |
|
Chromium |
0.001 |
<0.001 |
<0.001 |
<0.001 |
<0.001 |
|
Cobalt |
No value |
<0.0001 |
0.0003 |
0.0004 |
0.0004 |
|
Copper |
0.0014 |
0.0025 |
0.0016 |
0.0020 |
0.0017 |
|
Lead |
0.0034 |
<0.0001 |
<0.0001 |
<0.0001 |
<0.0001 |
|
Manganese |
1.9 |
<0.001 |
<0.001 |
<0.001 |
<0.001 |
|
Nickel |
0.011 |
0.0023 |
0.0023 |
0.0019 |
0.0022 |
|
Selenium |
0.005 |
<0.005 |
<0.005 |
<0.005 |
<0.005 |
|
Silver |
0.0005 |
<0.0001 |
<0.0001 |
<0.0001 |
<0.0001 |
|
Zinc |
0.008 |
<0.001 |
<0.001 |
<0.001 |
0.001 |
3ANZG (2018). Australian and New Zealand Guidelines for Fresh and Marine Water Quality. Australian and New Zealand Governments and Australian state and territory governments, Canberra ACT, Australia.
|
Metal in Water
|
ANZG 20183 |
Samples from the lower Darling-Barka River between Weir 32 and Pooncarie (dissolved metals) |
||||||
|---|---|---|---|---|---|---|---|---|
|
Water Quality Guideline for aquatic ecosystems (95% species protection) |
13 |
14 |
15 |
16 |
17 |
19 |
20 |
|
|
(mg/L) |
(mg/L) |
(mg/L) |
(mg/L) |
(mg/L) |
(mg/L) |
(mg/L) |
(mg/L) |
|
|
Aluminium |
0.055 |
<0.04 |
<0.04 |
<0.04 |
<0.04 |
<0.04 |
<0.04 |
<0.04 |
|
Arsenic |
0.013 |
0.004 |
0.005 |
0.005 |
0.005 |
0.005 |
0.004 |
0.005 |
|
Cadmium |
0.0002 |
<0.0001 |
<0.0001 |
<0.0001 |
<0.0001 |
<0.0001 |
<0.0001 |
<0.0001 |
|
Chromium |
0.001 |
<0.001 |
<0.001 |
<0.001 |
<0.001 |
<0.001 |
<0.001 |
<0.001 |
|
Cobalt |
No value |
0.0002 |
0.0002 |
0.0004 |
0.0004 |
0.004 |
0.003 |
0.003 |
|
Copper |
0.0014 |
0.0023 |
0.0023 |
0.0022 |
0.0020 |
0.0021 |
0.0019 |
0.0019 |
|
Lead |
0.0034 |
<0.0001 |
<0.0001 |
<0.0001 |
<0.0001 |
<0.0001 |
<0.0001 |
<0.0001 |
|
Manganese |
1.9 |
<0.001 |
<0.001 |
<0.001 |
<0.001 |
<0.001 |
<0.001 |
<0.001 |
|
Nickel |
0.011 |
0.0031 |
0.0033 |
0.0033 |
0.0034 |
0.0035 |
0.0035 |
0.0037 |
|
Selenium |
0.005 |
<0.005 |
<0.005 |
<0.005 |
<0.005 |
<0.005 |
<0.005 |
<0.005 |
|
Silver |
0.0005 |
<0.0001 |
<0.0001 |
<0.0001 |
<0.0001 |
<0.0001 |
<0.0001 |
<0.0001 |
|
Zinc |
0.008 |
<0.001 |
<0.001 |
0.001 |
0.001 |
<0.001 |
0.001 |
0.001 |
3ANZG (2018). Australian and New Zealand Guidelines for Fresh and Marine Water Quality. Australian and New Zealand Governments and Australian state and territory governments, Canberra ACT, Australia.
References
ANZG (2018), Australian and New Zealand Guidelines for Fresh and Marine Water Quality, Australian and New Zealand Governments and Australian state and territory governments, Canberra ACT, Australia. Available at www.waterquality.gov.au/anz-guidelines
Basin Plan (2012), Schedule 11, Water Act 2007, Murray-Darling Basin Authority, Commonwealth of Australia
NHMRC (2008), Guidelines for managing risks in recreational waters, Australian Government National Health and Medical Research Council
Download the full test results
20 June results
- Report for metals and pesticides – 20 June, Menindee weir pools (PDF 174KB)
- Report for algal toxins – 20 June, Menindee weir pools (PDF 219KB)
- Report for algal identification and cell count – 20 June, Menindee weir pools (PDF 216KB)
- Report for glyphosate and phenoxyherbicides – 20 June, Menindee weir pools (PDF 698KB)
- Report for nutrients – 20 June, Menindee weir pools (PDF 703KB)
21 June results
- Report for metals and pesticides – 21 June, Great Darling Anabranch and Lower Darling-Barka River (PDF 171KB)
- Report for algal toxins – 21 June, Great Darling Anabranch and Lower Darling-Barka River (PDF 217KB)
- Report for algal identification and cell count – 21 June, Great Darling Anabranch and Lower Darling-Barka River (PDF 216KB)
- Report for glyphosate and phenoxyherbicides – 21 June, Great Darling Anabranch and Lower Darling-Barka River (PDF 698KB)
- Report for nutrients – 21 June, Great Darling Anabranch and Lower Darling-Barka River (PDF 697KB)
22 June results
- Report for metals and pesticides – 22 June, Lower Darling-Barka River (PDF 161KB)
- Report for algal toxins – 22 June, Lower Darling-Barka River (PDF 180KB)
- Report for algal identification and cell count – 22 June, Lower Darling-Barka River (PDF 214KB)
- Report for glyphosate and phenoxyherbicides – 22 June, Lower Darling-Barka River (PDF 695KB)
- Report for nutrients – 22 June, Lower Darling-Barka River (PDF 697KB)
- Report for nutrients 2 – 22 June, Lower Darling-Barka River (PDF 690KB)
The Department of Planning and Environment (DPE) and the NSW Environment Protection Authority (EPA) collected eighteen water samples between 13 to 15 June 2023 at Menindee along the Darling-Barka River, downstream along the lower Darling-Barka River, and along the Great Darling Anabranch.
Samples were checked for pesticides, excess nitrogen and phosphorus, ammonia, metals, algae and algal toxins.
Two of the samples usually collected from the lower Darling-Barka region were unable to be sampled on this occasion, due to accessibility issues following heavy rain.
Summary
Pesticides
Samples were scanned for more than 600 pesticides. None were detected.
Nitrogen and phosphorus
Nitrogen and phosphorous levels are high. If nitrogen and phosphorus stay high they can cause algal blooms.
Algae and algal toxins
Blue-green algae were detected in all samples, but potentially toxic blue-green algae were detected in eleven of the samples. The algal toxin Cylindrospermopsin was detected in eight samples across all regions.
A ‘red alert’ is in place along parts of the lower Darling-Barka River. An ‘amber alert’ is in place along the Great Darling Anabranch and along the Darling-Barka River, at Menindee and further downstream, as of 25 July 2023. See WaterNSW for information about red alerts
Metals
Copper was slightly above the level set to protect water life in most samples across all 3 regions, but well below the level harmful to fish. All other metals were under the levels set to protect water life.
Sample locations
Water was sampled between 13 to 15 June 2023 from eighteen locations on the Darling-Barka River at Menindee, downstream along the lower Darling-Barka River, and along the Great Darling Anabranch.
On 13 June 2023, eight samples were collected from the Menindee Weir Pools in the Darling-Barka River. The correlating sample identifications are given in brackets for reference to the full laboratory report data.
- Sample 1 (B1) – Lake Wetherell upstream of the Main Weir
- Sample 2 (B2) – Outlet of Lake Pamamaroo into Darling River
- Sample 3 (E1) – Upper weir pool
- Sample 4 (E2) – Mid weir pool
- Sample 5 (E3) – Menindee town
- Sample 6 (E4) – Downstream Menindee town
- Sample 7 (E5) – Lower weir pool downstream Lake Menindee inflow
- Sample 8 (B3) – Outlet of Lake Menindee into Darling-Barka River
On 14 June 2023, four samples were collected from the Great Darling Anabranch region and three samples from the Lower Darling-Barka River between Weir 32 and Pooncarie.
- Sample 9 (B4) – Lake Cawndilla outlet into the anabranch of Darling River
- Sample 10 (E6) – Redbank Creek upstream of Cawndilla Channel confluence
- Sample 11 (E6.5) – Tandou Creek at Tandou Woolshed Rd (incorporating inflows from Kangaroo Lake)
- Sample 12 (E7) – Tandou Creek at Packers Crossing (incorporating inflows from Packers Lake)
- Sample 13 (E8) – Kinchega National Park upper
- Sample 14 (E9) – Kinchega National Park mid (incorporating inflows from Emu Lake)
- Sample 15 (E10) – Kinchega National Park lower (upstream of Anabranch offtake)
On 15 June 2023, three samples were collected from the Lower Darling-Barka River between Weir 32 and Pooncarie.
- Sample 17 (E12) – Karoola Station reach
- Sample 19 (E14) – Mullingar Station reach
- Sample 20 (E15) – Old wharf at Pooncarie
Sample 16 (E11) “Bindara Station reach” and Sample 18 (E13) “Coona Point reach” were unable to be sampled on this occasion, due to accessibility issues following heavy rain.


More sampling
The DPE and EPA are conducting regular water quality monitoring on the Darling-Barka River from upstream of Menindee to Pooncarie as well as the Great Darling Anabranch. The test results from these samples will also be published on this website.
In-field measurements
At the time of sampling, the EPA collected in-field measurements for pH, dissolved oxygen, conductivity, temperature and turbidity.
pH was outside the guideline value for some samples in the Great Darling Anabranch region.
Dissolved oxygen in a few samples around Menindee town (samples 5 and 6) has dropped to levels which may begin to stress fish if they remain low for prolonged periods.
All other parameters were within the expected ranges.
|
Sample |
Location |
Temp (°C) |
Dissolved oxygen (mg/L) |
Electrical conductivity (µS/cm) |
pH |
Turbidity (NTU) |
|---|---|---|---|---|---|---|
|
1 (B1) |
Lake Wetherell upstream of the Main Weir |
14.9 |
9.0 |
585 |
8.5 |
10.3 |
|
2 (B2) |
Outlet of Lake Pamamaroo into Darling River |
14.5 |
9.7 |
505 |
8.3 |
25.2 |
|
3 (E1) |
Upper weir pool |
14.3 |
8.3 |
532 |
8.1 |
22.2 |
|
4 (E2) |
Mid weir pool |
14.3 |
7.6 |
405 |
8.1 |
39.0 |
|
5 (E3) |
Menindee town |
14.9 |
4.6 |
418 |
7.8 |
41.6 |
|
6 (E4) |
Downstream Menindee town |
14.9 |
4.0 |
419 |
7.7 |
42.0 |
|
7 (E5) |
Lower weir pool downstream Lake Menindee inflow |
14.2 |
5.1 |
383 |
7.9 |
46.9 |
|
8 (B3) |
Outlet of Lake Menindee into Darling-Barka River |
14.2 |
9.6 |
332 |
8.3 |
64.1 |
|
9 (B4) |
Lake Cawndilla outlet into the anabranch of Darling River |
14.6 |
9.3 |
369 |
8.5 |
23.4 |
|
10 (E6) |
Redbank Creek upstream of Cawndilla Channel confluence |
15.6 |
16.3 |
425 |
9.2 |
28.4 |
|
11 (E6.5) |
Tandou Creek at Tandou Woolshed Rd (incorporating inflows from Kangaroo Lake) |
14.3 |
15.5 |
382 |
9.4 |
20.3 |
|
12 (E7) |
Tandou Creek at Packers Crossing (incorporating inflows from Packers Lake) |
14.7 |
9.1 |
385 |
8.8 |
34.1 |
|
13 (E8) |
Kinchega National Park upper |
13.7 |
7.5 |
378 |
7.8 |
53.5 |
|
14 (E9) |
Kinchega National Park mid (incorporating inflows from Emu Lake) |
13.4 |
8.0 |
379 |
7.9 |
52.2 |
|
15 (E10) |
Kinchega National Park lower (upstream of Anabranch offtake) |
13.4 |
8.0 |
386 |
8.02 |
55.6 |
|
17 (E12) |
Karoola Station reach |
12.9 |
7.7 |
380 |
7.8 |
51.8 |
|
19 (E14) |
Mullingar Station reach |
13.3 |
7.4 |
371 |
7.8 |
73.8 |
|
20 (E15) |
Old wharf at Pooncarie |
13.1 |
7.5 |
374 |
7.8 |
61.0 |
Nitrogen, phosphorus and ammonia
Sample results show that total nitrogen and total phosphorous are higher than the acceptable levels given for lowland river ecosystems in NSW (ANZG 2018, which are in agreement with the regionally specific set of guideline values for the Murray-Darling outlined in the Basin Plan 2012). Total nitrogen was detected at up to eight times higher than the guideline value while total phosphorous was detected at up to nine times higher. Algal blooms are possible if these nutrients remain elevated.
Bacteria convert nitrogen compounds such as ammonia into nitrite and nitrate. These compounds can harm aquatic organisms. Ammonia was well below the Australian and New Zealand water quality guidelines for toxicity. While the levels would not be expected to be harmful to fish, the ammonia could promote growth in algae and macrophytes. The ammonia is likely to be from river sources including rotting fish and flood organic matter rather than diffuse inputs from surrounding land.
Algae and algal toxins
There were positive detections in all samples for blue-green algae. However, only the blue-green algae detections found in samples 2, 3, 9 to 12, 14, 15, 17, 19 and 20. were considered potentially toxic. The algal toxin Cylindrospermopsin was detected in samples 10, 11, 12, 14, 15, 17, 19 and 20.
The algae levels detected fall within the ‘amber’ to ‘red’ alert levels. A ‘red alert’ is in place along parts of the lower Darling-Barka River. An ‘amber alert’ is in place along the Great Darling Anabranch and along the Darling-Barka River, at Menindee and further downstream, as of 25 July 2023.
Pesticides
As noted above, a pesticide screening test that scanned for over 600 pesticides was completed for samples from all three regions. All samples came back negative for pesticide detection.
Metals
Many metals are vital for humans and animals to stay healthy and only pose a risk if they are found at high levels in the environment. Concentrations of key metals found in water are below.
Total metals have been compared to recreational water quality guidelines and dissolved metals have been compared to ecological water quality guidelines as per the National Health and Medical Research Council (NHMRC) recreational and Australian and New Zealand Water Quality (ANZG) guidelines, respectively.
Total metals provide a more conservative estimate of exposure from recreational use whereas dissolved metals are used for ecological assessments as this is the bioavailable fraction of the metal (the part that is toxic to organisms).
|
Metal in Water |
NHMRC (2008)2 |
Samples from the Menindee Weir Pools along the Darling-Barka River (total acid-extractable metals) |
|||||||
|---|---|---|---|---|---|---|---|---|---|
|
Recreational Water Guidelines |
1 |
2 |
3 |
4 |
5 |
6 |
7 |
8 |
|
|
(mg/L) |
(mg/L) |
(mg/L) |
(mg/L) |
(mg/L) |
(mg/L) |
(mg/L) |
(mg/L) |
(mg/L) |
|
|
Aluminium |
No value |
0.74 |
2.6 |
2.3 |
4.0 |
3.0 |
3.4 |
2.4 |
4.8 |
|
Arsenic |
0.07 |
0.002 |
0.003 |
0.003 |
0.004 |
0.004 |
0.004 |
0.005 |
0.006 |
|
Chromium |
0.5 |
<0.001 |
0.002 |
0.003 |
0.004 |
0.003 |
0.003 |
0.002 |
0.004 |
|
Cobalt |
No value |
0.013 |
0.014 |
0.014 |
0.016 |
0.014 |
0.015 |
0.011 |
0.013 |
|
Copper |
20 |
0.0021 |
0.0032 |
0.0028 |
0.0044 |
0.0037 |
0.0038 |
0.0037 |
0.0051 |
|
Lead |
0.1 |
0.0007 |
0.0007 |
0.0007 |
0.0009 |
0.0009 |
0.0010 |
0.0008 |
0.0010 |
|
Nickel |
0.2 |
0.0040 |
0.0047 |
0.0047 |
0.0059 |
0.0055 |
0.0059 |
0.0046 |
0.0052 |
|
Zinc |
30 |
0.003 |
0.005 |
0.003 |
0.006 |
0.005 |
0.005 |
0.004 |
0.007 |
2NHMRC (2008) Guidelines for managing risks in recreational waters (10 x drinking water guideline value, Table 9.3)
|
Metal in Water |
NHMRC (2008)2 |
Samples from the Great Darling Anabranch region (total acid-extractable metals) |
|||
|---|---|---|---|---|---|
|
Recreational Water Guidelines |
9 |
10 |
11 |
12 |
|
|
(mg/L) |
(mg/L) |
(mg/L) |
(mg/L) |
(mg/L) |
|
|
Aluminium |
No value |
2.2 |
2.2 |
3.4 |
3.7 |
|
Arsenic |
0.07 |
0.006 |
0.005 |
0.007 |
0.007 |
|
Chromium |
0.5 |
0.002 |
0.002 |
0.003 |
0.003 |
|
Cobalt |
No value |
0.0006 |
0.0031 |
0.0016 |
0.0018 |
|
Copper |
20 |
0.0042 |
0.0026 |
0.0050 |
0.0042 |
|
Lead |
0.1 |
0.0005 |
0.0009 |
0.0011 |
0.0010 |
|
Nickel |
0.2 |
0.0038 |
0.0049 |
0.0046 |
0.0049 |
|
Zinc |
30 |
0.008 |
0.006 |
0.010 |
0.006 |
2NHMRC (2008) Guidelines for managing risks in recreational waters (10 x drinking water guideline value, Table 9.3)
|
Metal in water |
NHMRC (2008)2 |
Samples from the lower Darling-Barka River between Weir 32 and Pooncarie (total acid-extractable metals) |
|||||
|---|---|---|---|---|---|---|---|
|
Recreational Water Guidelines |
13 |
14 |
15 |
17 |
19 |
20 |
|
|
(mg/L) |
(mg/L) |
(mg/L) |
(mg/L) |
(mg/L) |
(mg/L) |
(mg/L) |
|
|
Aluminium |
No value |
6.2 |
6.0 |
6.9 |
5.6 |
8.2 |
4.6 |
|
Arsenic |
0.07 |
0.005 |
0.005 |
0.006 |
0.005 |
0.005 |
0.005 |
|
Chromium |
0.5 |
0.006 |
0.006 |
0.007 |
0.006 |
0.008 |
0.004 |
|
Cobalt |
No value |
0.0021 |
0.0021 |
0.0030 |
0.0023 |
0.0029 |
0.0020 |
|
Copper |
20 |
0.0054 |
0.0055 |
0.0063 |
0.0053 |
0.0065 |
0.0047 |
|
Lead |
0.1 |
0.0014 |
0.0013 |
0.0018 |
0.0014 |
0.0019 |
0.0014 |
|
Nickel |
0.2 |
0.0071 |
0.0069 |
0.0081 |
0.0076 |
0.0086 |
0.0066 |
|
Zinc |
30 |
0.012 |
0.009 |
0.012 |
0.011 |
0.013 |
0.009 |
2NHMRC (2008) Guidelines for managing risks in recreational waters (10 x drinking water guideline value, Table 9.3)
|
Metal in Water |
ANZG 20183 |
Samples from the Menindee Weir Pools along the Darling-Barka River (dissolved metals) |
|||||||
|---|---|---|---|---|---|---|---|---|---|
|
Water Quality Guideline for aquatic ecosystems (95% species protection) |
1 |
2 |
3 |
4 |
5 |
6 |
7 |
8 |
|
|
(mg/L) |
(mg/L) |
(mg/L) |
(mg/L) |
(mg/L) |
(mg/L) |
(mg/L) |
(mg/L) |
(mg/L) |
|
|
Aluminium |
0.055 |
<0.04 |
<0.04 |
<0.04 |
<0.04 |
<0.04 |
<0.04 |
<0.04 |
<0.04 |
|
Arsenic |
0.013 |
0.002 |
0.003 |
0.002 |
0.004 |
0.004 |
0.003 |
0.005 |
0.006 |
|
Cadmium |
0.0002 |
<0.0001 |
<0.0001 |
<0.0001 |
<0.0001 |
<0.0001 |
<0.0001 |
<0.0001 |
<0.0001 |
|
Chromium |
0.001 |
<0.001 |
<0.001 |
<0.001 |
<0.001 |
<0.001 |
<0.001 |
<0.001 |
<0.001 |
|
Cobalt |
No value |
0.0002 |
0.0002 |
0.0002 |
0.0002 |
0.0002 |
0.0002 |
0.0002 |
0.0001 |
|
Copper |
0.0014 |
0.0011 |
0.0017 |
0.0014 |
0.0023 |
0.0022 |
0.0020 |
0.0023 |
0.0028 |
|
Lead |
0.0034 |
<0.0001 |
<0.0001 |
<0.0001 |
<0.0001 |
<0.0001 |
<0.0001 |
<0.0001 |
<0.0001 |
|
Manganese |
1.9 |
<0.001 |
<0.001 |
<0.001 |
<0.001 |
<0.001 |
<0.001 |
<0.001 |
<0.001 |
|
Nickel |
0.011 |
0.0026 |
0.0029 |
0.0029 |
0.0034 |
0.0035 |
0.0037 |
0.0031 |
0.0023 |
|
Selenium |
0.005 |
<0.005 |
<0.005 |
<0.005 |
<0.005 |
<0.005 |
<0.005 |
<0.005 |
<0.005 |
|
Silver |
0.0005 |
<0.0001 |
<0.0001 |
<0.0001 |
<0.0001 |
<0.0001 |
<0.0001 |
<0.0001 |
<0.0001 |
|
Zinc |
0.008 |
<0.001 |
<0.001 |
<0.001 |
<0.001 |
0.001 |
<0.001 |
<0.001 |
<0.001 |
3ANZG (2018). Australian and New Zealand Guidelines for Fresh and Marine Water Quality. Australian and New Zealand Governments and Australian state and territory governments, Canberra ACT, Australia.
|
Metal in Water |
ANZG 20183 |
Samples from the Great Darling Anabranch region (dissolved metals) |
|||
|---|---|---|---|---|---|
|
Water Quality Guideline for aquatic ecosystems (95% species protection) |
9 |
10 |
11 |
12 |
|
|
(mg/L) |
(mg/L) |
(mg/L) |
(mg/L) |
(mg/L) |
|
|
Aluminium |
0.055 |
<0.04 |
<0.04 |
<0.04 |
<0.04 |
|
Arsenic |
0.013 |
0.006 |
0.005 |
0.007 |
0.007 |
|
Cadmium |
0.0002 |
<0.0001 |
<0.0001 |
<0.0001 |
<0.0001 |
|
Chromium |
0.001 |
<0.001 |
<0.001 |
<0.001 |
<0.001 |
|
Cobalt |
No value |
<0.0001 |
0.0016 |
0.0004 |
0.0003 |
|
Copper |
0.0014 |
0.0027 |
0.0010 |
0.0019 |
0.0016 |
|
Lead |
0.0034 |
<0.0001 |
<0.0001 |
<0.0001 |
<0.0001 |
|
Manganese |
1.9 |
<0.001 |
0.002 |
<0.001 |
<0.001 |
|
Nickel |
0.011 |
0.0024 |
0.0028 |
0.0017 |
0.0021 |
|
Selenium |
0.005 |
<0.005 |
<0.005 |
<0.005 |
<0.005 |
|
Silver |
0.0005 |
<0.0001 |
<0.0001 |
<0.0001 |
<0.0001 |
|
Zinc |
0.008 |
0.002 |
<0.001 |
0.001 |
0.001 |
3ANZG (2018). Australian and New Zealand Guidelines for Fresh and Marine Water Quality. Australian and New Zealand Governments and Australian state and territory governments, Canberra ACT, Australia.
|
Metal in Water |
ANZG 20183 |
Samples from the lower Darling-Barka River between Weir 32 and Pooncarie (dissolved metals) |
|||||
|---|---|---|---|---|---|---|---|
|
Water Quality Guideline for aquatic ecosystems (95% species protection) |
13 |
14 |
15 |
17 |
19 |
20 |
|
|
(mg/L) |
(mg/L) |
(mg/L) |
(mg/L) |
(mg/L) |
(mg/L) |
(mg/L) |
|
|
Aluminium |
0.055 |
<0.04 |
<0.04 |
<0.04 |
<0.04 |
<0.04 |
<0.04 |
|
Arsenic |
0.013 |
0.004 |
0.005 |
0.005 |
0.005 |
0.005 |
0.005 |
|
Cadmium |
0.0002 |
<0.0001 |
<0.0001 |
<0.0001 |
<0.0001 |
<0.0001 |
<0.0001 |
|
Chromium |
0.001 |
<0.001 |
<0.001 |
<0.001 |
<0.001 |
<0.001 |
<0.001 |
|
Cobalt |
No value |
0.0002 |
0.0002 |
0.0004 |
0.0003 |
0.0002 |
0.0003 |
|
Copper |
0.0014 |
0.0024 |
0.0023 |
0.0024 |
0.0022 |
0.0020 |
0.0020 |
|
Lead |
0.0034 |
<0.0001 |
<0.0001 |
<0.0001 |
<0.0001 |
<0.0001 |
<0.0001 |
|
Manganese |
1.9 |
<0.001 |
<0.001 |
<0.001 |
<0.001 |
<0.001 |
<0.001 |
|
Nickel |
0.011 |
0.0031 |
0.0032 |
0.0035 |
0.0036 |
0.0034 |
0.0035 |
|
Selenium |
0.005 |
<0.005 |
<0.005 |
<0.005 |
<0.005 |
<0.005 |
<0.005 |
|
Silver |
0.0005 |
<0.0001 |
<0.0001 |
<0.0001 |
<0.0001 |
<0.0001 |
<0.0001 |
|
Zinc |
0.008 |
<0.001 |
<0.001 |
<0.001 |
<0.001 |
<0.001 |
<0.001 |
3ANZG (2018). Australian and New Zealand Guidelines for Fresh and Marine Water Quality. Australian and New Zealand Governments and Australian state and territory governments, Canberra ACT, Australia.
References
ANZG (2018), Australian and New Zealand Guidelines for Fresh and Marine Water Quality, Australian and New Zealand Governments and Australian state and territory governments, Canberra ACT, Australia. Available at www.waterquality.gov.au/anz-guidelines
Basin Plan (2012), Schedule 11, Water Act 2007, Murray-Darling Basin Authority, Commonwealth of Australia
NHMRC (2008), Guidelines for managing risks in recreational waters, Australian Government National Health and Medical Research Council
Download the full test results
13 June results
- Report for metals and pesticides – 13 June, Menindee weir pools (PDF 176KB)
- Report for algal toxins – 13 June, Menindee weir pools (PDF 185KB)
- Report for algal identification and cell count – 13 June, Menindee weir pools (PDF 215KB)
- Report for glyphosate and phenoxyherbicides – 13 June, Menindee weir pools (PDF 698KB)
- Report for nutrients – 13 June, Menindee weir pools (PDF 706KB)
14 June results
- Report for metals and pesticides – 14 June, Great Darling Anabranch and Lower Darling-Barka River (PDF 169KB)
- Report for algal toxins – 14 June, Great Darling Anabranch and Lower Darling-Barka River (PDF 186KB)
- Report for algal identification and cell count – 14 June, Great Darling Anabranch and Lower Darling-Barka River (PDF 217KB)
- Report for glyphosate and phenoxyherbicides – 14 June, Great Darling Anabranch and Lower Darling-Barka River (PDF 698KB)
- Report for nutrients – 14 June, Great Darling Anabranch and Lower Darling-Barka River (PDF 700KB)
15 June results
- Report for metals and pesticides – 15 June, Lower Darling-Barka River (PDF 158KB)
- Report for algal toxins – 15 June, Lower Darling-Barka River (PDF 168KB)
- Report for algal identification and cell count – 15 June, Lower Darling-Barka River (PDF 213KB)
- Report for nutrients, glyphosate and phenoxyherbicides – 15 June, Lower Darling-Barka River (PDF 703KB)
The Department of Planning and Environment (DPE) and the NSW Environment Protection Authority (EPA) collected eight water samples on 6 June 2023 at Menindee along the Darling-Barka River, downstream along the lower Darling-Barka River, and along the Great Darling Anabranch.
Samples were checked for pesticides, excess nitrogen and phosphorus, ammonia, metals, algae and algal toxins.
Routine sampling for this round was interrupted by road closures due to inclement weather. As a result, the additional twelve samples usually collected as part of the round from the Great Darling Anabranch and lower Darling-Barka River were not able to be collected.
Summary
Pesticides
Samples were scanned for more than 600 pesticides. None were detected.
Nitrogen and phosphorus
Nitrogen and phosphorous levels are high. If nitrogen and phosphorus stay high they can cause algal blooms.
Algae and algal toxins
Blue-green algae were detected in all samples, but potentially toxic blue-green algae were detected in one of the samples. The algal toxin Cylindrospermopsin was not detected in any of the samples.
An ‘amber alert’ is in place along at Menindee and further downstream, as of 25 July 2023. See WaterNSW for information about alerts
Metals
Copper was slightly above the level set to protect water life in most samples, but well below the level harmful to fish. All other metals were under the levels set to protect water life.
Sample locations
On 6 June 2023, eight samples were collected from the Menindee Weir Pools in the Darling-Barka River. The correlating sample identifications are given in brackets for reference to the full laboratory report data.
- Sample 1 (B1) – Lake Wetherell upstream of the Main Weir
- Sample 2 (B2) – Outlet of Lake Pamamaroo into Darling River
- Sample 3 (E1) – Upper weir pool
- Sample 4 (E2) – Mid weir pool
- Sample 5 (E3) – Menindee town
- Sample 6 (E4) – Downstream Menindee town
- Sample 7 (E5) – Lower weir pool downstream Lake Menindee inflow
- Sample 8 (B3) – Outlet of Lake Menindee into Darling-Barka River
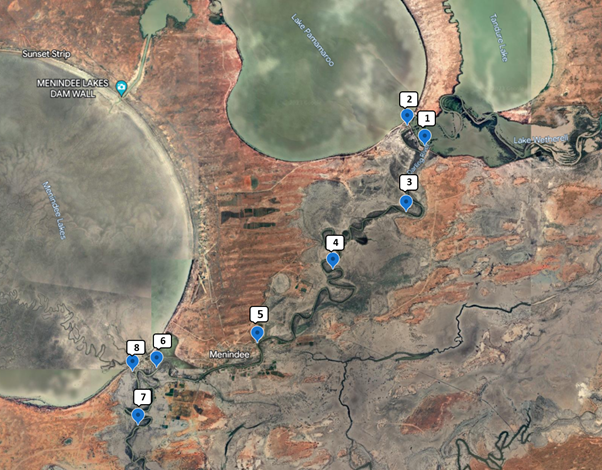
More sampling
The DPE and EPA are conducting regular water quality monitoring on the Darling-Barka River from upstream of Menindee to Pooncarie as well as the Great Darling Anabranch. The test results from these samples will also be published on this website.
In-field measurements
At the time of sampling, the EPA collected in-field measurements for pH, dissolved oxygen, conductivity, temperature and turbidity.
All parameters were within the expected ranges.
|
Sample |
Location |
Temp (°C) |
Dissolved oxygen (mg/L) |
Electrical conductivity (µS/cm) |
pH |
Turbidity (NTU) |
|---|---|---|---|---|---|---|
|
1 (B1) |
Lake Wetherell upstream of the Main Weir |
17.4 |
8.9 |
628 |
8.4 |
10.0 |
|
2 (B2) |
Outlet of Lake Pamamaroo into Darling River |
15.0 |
8.5 |
400 |
8.3 |
39.2 |
|
3 (E1) |
Upper weir pool |
15.4 |
8.3 |
425 |
8.3 |
36.9 |
|
4 (E2) |
Mid weir pool |
16.1 |
7.3 |
430 |
8.1 |
33.9 |
|
5 (E3) |
Menindee town |
14.8 |
5.5 |
412 |
7.9 |
36.6 |
|
6 (E4) |
Downstream Menindee town |
15.2 |
4.8 |
416 |
7.9 |
42.0 |
|
7 (E5) |
Lower weir pool downstream Lake Menindee inflow |
16.3 |
6.9 |
395 |
8.1 |
44.2 |
|
8 (B3) |
Outlet of Lake Menindee into Darling-Barka River |
15.2 |
9.4 |
338 |
8.3 |
55.6 |
Nitrogen, phosphorus and ammonia
Sample results show that total nitrogen and total phosphorous are higher than the acceptable levels given for lowland river ecosystems in NSW (ANZG 2018, which are in agreement with the regionally specific set of guideline values for the Murray-Darling outlined in the Basin Plan 2012). Total nitrogen was detected at up to three times higher than the guideline value while total phosphorous was detected at up to eight times higher. Algal blooms are possible if these nutrients remain elevated.
Bacteria convert nitrogen compounds such as ammonia into nitrite and nitrate. These compounds can harm aquatic organisms. Ammonia was well below the Australian and New Zealand water quality guidelines for toxicity. While the levels would not be expected to be harmful to fish, the ammonia could promote growth in algae and macrophytes. The ammonia is likely to be from river sources including rotting fish and flood organic matter rather than diffuse inputs from surrounding land.
Algae and algal toxins
There were positive detections in all samples for blue-green algae. However, only the blue-green algae detections found in sample 1 were considered potentially toxic. The algal toxin Cylindrospermopsin was not detected in any samples from this region.
The algae levels detected fall within the ‘amber’ alert levels. An ‘amber alert’ is in place at Menindee and further downstream, as of 25 July 2023.
Pesticides
As noted above, a pesticide screening test that scanned for over 600 pesticides was completed for all samples. All samples came back negative for pesticide detection.
Metals
Many metals are vital for humans and animals to stay healthy and only pose a risk if they are found at high levels in the environment. Concentrations of key metals found in water are below.
Total metals have been compared to recreational water quality guidelines and dissolved metals have been compared to ecological water quality guidelines as per the National Health and Medical Research Council (NHMRC) recreational and Australian and New Zealand Water Quality (ANZG) guidelines, respectively.
Total metals provide a more conservative estimate of exposure from recreational use whereas dissolved metals are used for ecological assessments as this is the bioavailable fraction of the metal (the part that is toxic to organisms).
|
Metal in Water |
NHMRC (2008)2 |
Samples from the Menindee Weir Pools along the Darling-Barka River (total acid-extractable metals) |
|||||||
|---|---|---|---|---|---|---|---|---|---|
|
Recreational Water Guidelines |
1 |
2 |
3 |
4 |
5 |
6 |
7 |
8 |
|
|
(mg/L) |
(mg/L) |
(mg/L) |
(mg/L) |
(mg/L) |
(mg/L) |
(mg/L) |
(mg/L) |
(mg/L) |
|
|
Aluminium |
No value |
0.82 |
3.3 |
4.1 |
3.6 |
4.2 |
4.4 |
4.7 |
6.1 |
|
Arsenic |
0.07 |
0.002 |
0.004 |
0.004 |
0.004 |
0.004 |
0.004 |
0.004 |
0.006 |
|
Chromium |
0.5 |
<0.001 |
0.003 |
0.004 |
0.003 |
0.004 |
0.004 |
0.004 |
0.006 |
|
Cobalt |
No value |
0.0011 |
0.0014 |
0.0016 |
0.0015 |
0.0017 |
0.0017 |
0.0015 |
0.0014 |
|
Copper |
20 |
0.0018 |
0.0042 |
0.0043 |
0.0040 |
0.0044 |
0.0042 |
0.0046 |
0.0055 |
|
Lead |
0.1 |
0.0005 |
0.0007 |
0.0008 |
0.0008 |
0.0009 |
0.0009 |
0.0010 |
0.0010 |
|
Nickel |
0.2 |
0.0035 |
0.0056 |
0.0061 |
0.0058 |
0.0062 |
0.0062 |
0.0060 |
0.0059 |
|
Zinc |
30 |
0.002 |
0.005 |
0.006 |
0.005 |
0.007 |
0.006 |
0.007 |
0.009 |
2NHMRC (2008) Guidelines for managing risks in recreational waters (10 x drinking water guideline value, Table 9.3)
|
Metal in Water |
ANZG 20183 |
Samples from the Menindee Weir Pools along the Darling-Barka River (dissolved metals) |
|||||||
|---|---|---|---|---|---|---|---|---|---|
|
Water Quality Guideline for aquatic ecosystems (95% species protection) |
1 |
2 |
3 |
4 |
5 |
6 |
7 |
8 |
|
|
(mg/L) |
(mg/L) |
(mg/L) |
(mg/L) |
(mg/L) |
(mg/L) |
(mg/L) |
(mg/L) |
(mg/L) |
|
|
Aluminium |
0.055 |
<0.04 |
<0.04 |
<0.04 |
<0.04 |
<0.04 |
<0.04 |
<0.04 |
<0.04 |
|
Arsenic |
0.013 |
0.002 |
0.004 |
0.004 |
0.004 |
0.004 |
0.004 |
0.004 |
0.006 |
|
Cadmium |
0.0002 |
<0.0001 |
<0.0001 |
<0.0001 |
<0.0001 |
<0.0001 |
<0.0001 |
<0.0001 |
<0.0001 |
|
Chromium |
0.001 |
<0.001 |
<0.001 |
<0.001 |
<0.001 |
<0.001 |
<0.001 |
<0.001 |
<0.001 |
|
Cobalt |
No value |
0.0002 |
0.0002 |
0.0002 |
0.0002 |
0.0002 |
0.0002 |
0.0002 |
0.0001 |
|
Copper |
0.0014 |
0.0011 |
0.0025 |
0.0022 |
0.0021 |
0.0022 |
0.0019 |
0.0022 |
0.0027 |
|
Lead |
0.0034 |
<0.0001 |
<0.0001 |
<0.0001 |
<0.0001 |
<0.0001 |
<0.0001 |
<0.0001 |
<0.0001 |
|
Manganese |
1.9 |
<0.001 |
<0.001 |
<0.001 |
<0.001 |
<0.001 |
<0.001 |
<0.001 |
<0.001 |
|
Nickel |
0.011 |
0.0025 |
0.0034 |
0.0034 |
0.0035 |
0.0036 |
0.0036 |
0.0032 |
0.0022 |
|
Selenium |
0.005 |
<0.005 |
<0.005 |
<0.005 |
<0.005 |
<0.005 |
<0.005 |
<0.005 |
<0.005 |
|
Silver |
0.0005 |
<0.0001 |
<0.0001 |
<0.0001 |
<0.0001 |
<0.0001 |
<0.0001 |
<0.0001 |
<0.0001 |
|
Zinc |
0.008 |
0.001 |
<0.001 |
<0.001 |
<0.001 |
<0.001 |
<0.001 |
<0.001 |
0.001 |
3ANZG (2018). Australian and New Zealand Guidelines for Fresh and Marine Water Quality. Australian and New Zealand Governments and Australian state and territory governments, Canberra ACT, Australia.
References
ANZG (2018), Australian and New Zealand Guidelines for Fresh and Marine Water Quality, Australian and New Zealand Governments and Australian state and territory governments, Canberra ACT, Australia. Available at www.waterquality.gov.au/anz-guidelines
Basin Plan (2012), Schedule 11, Water Act 2007, Murray-Darling Basin Authority, Commonwealth of Australia
NHMRC (2008), Guidelines for managing risks in recreational waters, Australian Government National Health and Medical Research Council
Download the full test results
6 June results
- Report for metals and pesticides – 6 June, Menindee weir pools (PDF 178KB)
- Report for algal toxins – 6 June, Menindee weir pools (PDF 181KB)
- Report for algal identification and cell count – 6 June, Menindee weir pools (PDF 223KB)
- Report for glyphosate and phenoxyherbicides – 6 June, Menindee weir pools (PDF 698KB)
- Report for nutrients – 6 June, Menindee weir pools (PDF 709KB)
The Department of Planning and Environment (DPE) and the NSW Environment Protection Authority (EPA) collected twenty water samples between 30 May to 1 June 2023 at Menindee along the Darling-Barka River, downstream along the lower Darling-Barka River, and along the Great Darling Anabranch.
Samples were checked for pesticides, excess nitrogen and phosphorus, ammonia, metals, algae and algal toxins.
Summary
Pesticides
Samples were scanned for more than 600 pesticides. None were detected.
Nitrogen and phosphorus
Nitrogen and phosphorous levels are high. If nitrogen and phosphorus stay high they can cause algal blooms.
Algae and algal toxins
Blue-green algae were detected in all samples, but potentially toxic blue-green algae were detected in fifteen of the samples. The algal toxin Cylindrospermopsin was detected in ten samples across all regions.
A ‘red alert’ is in place along parts of the lower Darling-Barka River. An ‘amber alert’ is in place along the Great Darling Anabranch and along the Darling-Barka River, at Menindee and further downstream, as of 25 July 2023. See WaterNSW for information about red alerts
Metals
Copper was slightly above the level set to protect water life in most samples across all 3 regions, but well below the level harmful to fish. All other metals were under the levels set to protect water life.
Sample locations
Water was sampled between 30 May to 1 June 2023 from twenty locations on the Darling-Barka River at Menindee, downstream along the lower Darling-Barka River, and along the Great Darling Anabranch.
On 30 May 2023, eight samples were collected from the Menindee Weir Pools in the Darling-Barka River. The correlating sample identifications are given in brackets for reference to the full laboratory report data.
- Sample 1 (B1) – Lake Wetherell upstream of the Main Weir
- Sample 2 (B2) – Outlet of Lake Pamamaroo into Darling River
- Sample 3 (E1) – Upper weir pool
- Sample 4 (E2) – Mid weir pool
- Sample 5 (E3) – Menindee town
- Sample 6 (E4) – Downstream Menindee town
- Sample 7 (E5) – Lower weir pool downstream Lake Menindee inflow
- Sample 8 (B3) – Outlet of Lake Menindee into Darling-Barka River
On 31 May 2023, four samples were collected from the Great Darling Anabranch region and three samples from the Lower Darling-Barka River between Weir 32 and Pooncarie.
- Sample 9 (B4) – Lake Cawndilla outlet into the anabranch of Darling River
- Sample 10 (E6) – Redbank Creek upstream of Cawndilla Channel confluence
- Sample 11 (E6.5) – Tandou Creek at Tandou Woolshed Rd (incorporating inflows from Kangaroo Lake)
- Sample 12 (E7) – Tandou Creek at Packers Crossing (incorporating inflows from Packers Lake)
- Sample 13 (E8) – Kinchega National Park upper
- Sample 14 (E9) – Kinchega National Park mid (incorporating inflows from Emu Lake)
- Sample 15 (E10) – Kinchega National Park lower (upstream of Anabranch offtake)
On 1 June 2023, five samples were collected from the Lower Darling-Barka River between Weir 32 and Pooncarie.
- Sample 16 (E11) – Bindara Station reach
- Sample 17 (E12) – Karoola Station reach
- Sample 18 (E13) – Coona Point reach
- Sample 19 (E14) – Mullingar Station reach
- Sample 20 (E15) – Old wharf at Pooncarie


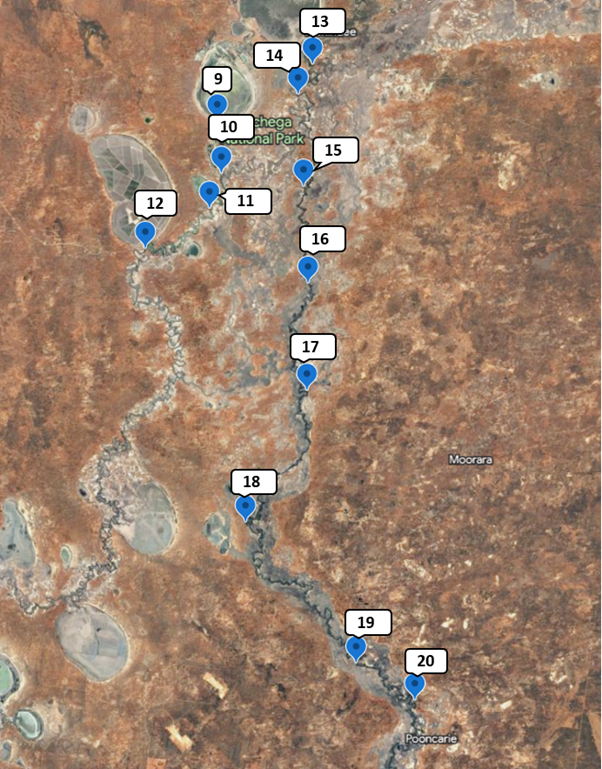
More sampling
The DPE and EPA are conducting regular water quality monitoring on the Darling-Barka River from upstream of Menindee to Pooncarie as well as the Great Darling Anabranch. The test results from these samples will also be published on this website.
In-field measurements
At the time of sampling, the EPA collected in-field measurements for pH, dissolved oxygen, conductivity, temperature and turbidity.
pH was outside the guideline value for all samples in the Great Darling Anabranch region, and some samples in the Menindee Weir Pool region.
All other parameters were within the expected ranges.
|
Sample |
Location |
Temp (°C) |
Dissolved oxygen (mg/L) |
Electrical conductivity (µS/cm) |
pH |
Turbidity (NTU) |
|---|---|---|---|---|---|---|
|
1 (B1) |
Lake Wetherell upstream of the Main Weir |
14.1 |
8.1 |
566 |
8.3 |
8.4 |
|
2 (B2) |
Outlet of Lake Pamamaroo into Darling River |
14.2 |
9.9 |
394 |
8.5 |
34.9 |
|
3 (E1) |
Upper weir pool |
14.6 |
9.3 |
408 |
8.5 |
32.3 |
|
4 (E2) |
Mid weir pool |
14.4 |
8.4 |
406 |
8.3 |
32.0 |
|
5 (E3) |
Menindee town |
14.2 |
7.9 |
404 |
8.2 |
34.5 |
|
6 (E4) |
Downstream Menindee town |
15.5 |
8.5 |
415 |
8.2 |
36.2 |
|
7 (E5) |
Lower weir pool downstream Lake Menindee inflow |
14.1 |
7.6 |
373 |
8.1 |
48.1 |
|
8 (B3) |
Outlet of Lake Menindee into Darling-Barka River |
14.3 |
9.9 |
337 |
8.4 |
58.0 |
|
9 (B4) |
Lake Cawndilla outlet into the anabranch of Darling River |
14.7 |
9.9 |
369 |
8.5 |
22.0 |
|
10 (E6) |
Redbank Creek upstream of Cawndilla Channel confluence |
15.9 |
12.2 |
386 |
9.1 |
20.1 |
|
11 (E6.5) |
Tandou Creek at Tandou Woolshed Rd (incorporating inflows from Kangaroo Lake) |
16.4 |
13.3 |
391 |
9.0 |
22.5 |
|
12 (E7) |
Tandou Creek at Packers Crossing (incorporating inflows from Packers Lake) |
15.3 |
8.2 |
393 |
8.7 |
43.8 |
|
13 (E8) |
Kinchega National Park upper |
13.6 |
8.5 |
370 |
8.0 |
52.1 |
|
14 (E9) |
Kinchega National Park mid (incorporating inflows from Emu Lake) |
13.8 |
8.3 |
373 |
8.0 |
55.7 |
|
15 (E10) |
Kinchega National Park lower (upstream of Anabranch offtake) |
14.1 |
7.9 |
388 |
8.0 |
52.8 |
|
16 (E11) |
Bindara Station reach |
14.9 |
7.9 |
397 |
7.9 |
59.5 |
|
17 (E12) |
Karoola Station reach |
14.0 |
7.3 |
391 |
7.8 |
60.2 |
|
18 (E13) |
Coona Point reach |
14.2 |
7.9 |
391 |
7.8 |
59.5 |
|
19 (E14) |
Mullingar Station reach |
14.3 |
8.6 |
396 |
7.9 |
58.1 |
|
20 (E15) |
Old wharf at Pooncarie |
13.8 |
8.5 |
399 |
7.9 |
61.5 |
Nitrogen, phosphorus and ammonia
Sample results show that total nitrogen and total phosphorous are higher than the acceptable levels given for lowland river ecosystems in NSW (ANZG 2018, which are in agreement with the regionally specific set of guideline values for the Murray-Darling outlined in the Basin Plan 2012). Total nitrogen was detected at up to four times higher than the guideline value while total phosphorous was detected at up to seven times higher. Algal blooms are possible if these nutrients remain elevated.
Bacteria convert nitrogen compounds such as ammonia into nitrite and nitrate. These compounds can harm aquatic organisms. Ammonia was well below the Australian and New Zealand water quality guidelines for toxicity. While the levels would not be expected to be harmful to fish, the ammonia could promote growth in algae and macrophytes. The ammonia is likely to be from river sources including rotting fish and flood organic matter rather than diffuse inputs from surrounding land.
Algae and algal toxins
There were positive detections in all samples for blue-green algae. However, only the blue-green algae detections found in samples 1, 2, 3, 4, 9 to 12 and 14 to 20. were considered potentially toxic. The algal toxin Cylindrospermopsin was detected in samples 1, 10, 11, 12 and 15 to 20.
The algae levels detected fall within the ‘amber’ to ‘red’ alert levels. A ‘red alert’ is in place along parts of the lower Darling-Barka River. An ‘amber alert’ is in place along the Great Darling Anabranch and along the Darling-Barka River, at Menindee and further downstream, as of 25 July 2023.
Pesticides
As noted above, a pesticide screening test that scanned for over 600 pesticides was completed for samples from all three regions. All samples came back negative for pesticide detection.
Metals
Many metals are vital for humans and animals to stay healthy and only pose a risk if they are found at high levels in the environment. Concentrations of key metals found in water are below.
Total metals have been compared to recreational water quality guidelines and dissolved metals have been compared to ecological water quality guidelines as per the National Health and Medical Research Council (NHMRC) recreational and Australian and New Zealand Water Quality (ANZG) guidelines, respectively.
Total metals provide a more conservative estimate of exposure from recreational use whereas dissolved metals are used for ecological assessments as this is the bioavailable fraction of the metal (the part that is toxic to organisms).
|
Metal in Water |
NHMRC (2008)2 |
Samples from the Menindee Weir Pools along the Darling-Barka River (total acid-extractable metals) |
|||||||
|---|---|---|---|---|---|---|---|---|---|
|
Recreational Water Guidelines |
1 |
2* |
3 |
4 |
5 |
6 |
7 |
8 |
|
|
(mg/L) |
(mg/L) |
(mg/L) |
(mg/L) |
(mg/L) |
(mg/L) |
(mg/L) |
(mg/L) |
(mg/L) |
|
|
Aluminium |
No value |
0.57 |
nm |
3.4 |
3.2 |
3.6 |
3.8 |
5.0 |
6.3 |
|
Arsenic |
0.07 |
0.002 |
nm |
0.004 |
0.004 |
0.004 |
0.004 |
0.005 |
0.006 |
|
Chromium |
0.5 |
<0.001 |
nm |
0.003 |
0.003 |
0.004 |
0.004 |
0.005 |
0.006 |
|
Cobalt |
No value |
0.0009 |
nm |
0.0014 |
0.0014 |
0.0015 |
0.0015 |
0.0016 |
0.0015 |
|
Copper |
20 |
0.0016 |
nm |
0.0046 |
0.0042 |
0.0043 |
00042 |
0.0051 |
0.0064 |
|
Lead |
0.1 |
0.0008 |
nm |
0.0011 |
0.0011 |
0.0012 |
0.0013 |
0.0014 |
0.0015 |
|
Nickel |
0.2 |
0.0033 |
nm |
0.0057 |
0.0057 |
0.0060 |
0.0059 |
0.0062 |
0.0062 |
|
Zinc |
30 |
0.002 |
nm |
0.006 |
0.005 |
0.006 |
0.007 |
0.008 |
0.010 |
2NHMRC (2008) Guidelines for managing risks in recreational waters (10 x drinking water guideline value, Table 9.3)
*Please note, sample 2 was not measured (nm) for metals because of damage to the sample on arrival at the laboratory.
|
Metal in Water |
NHMRC (2008)2 |
Samples from the Great Darling Anabranch region (total acid-extractable metals) |
|||
|---|---|---|---|---|---|
|
Recreational Water Guidelines |
9 |
10 |
11 |
12 |
|
|
(mg/L) |
(mg/L) |
(mg/L) |
(mg/L) |
(mg/L) |
|
|
Aluminium |
No value |
2.8 |
1.9 |
2.7 |
5.1 |
|
Arsenic |
0.07 |
0.007 |
0.004 |
0.007 |
0.007 |
|
Chromium |
0.5 |
0.002 |
0.002 |
0.003 |
0.005 |
|
Cobalt |
No value |
0.0005 |
0.0015 |
0.0011 |
0.0016 |
|
Copper |
20 |
0.0037 |
0.0035 |
0.0040 |
0.0049 |
|
Lead |
0.1 |
0.0007 |
0.0009 |
0.0010 |
0.0015 |
|
Nickel |
0.2 |
0.0037 |
0.0040 |
0.0040 |
0.0055 |
|
Zinc |
30 |
0.004 |
0.004 |
0.005 |
0.008 |
2NHMRC (2008) Guidelines for managing risks in recreational waters (10 x drinking water guideline value, Table 9.3)
|
Metal in Water |
NHMRC (2008)2 |
Samples from the lower Darling-Barka River between Weir 32 and Pooncarie (total acid-extractable metals) |
|||||||
|---|---|---|---|---|---|---|---|---|---|
|
Recreational Water Guidelines |
13 |
14 |
15 |
16 |
17 |
18 |
19 |
20 |
|
|
(mg/L) |
(mg/L) |
(mg/L) |
(mg/L) |
(mg/L) |
(mg/L) |
(mg/L) |
(mg/L) |
(mg/L) |
|
|
Aluminium |
No value |
6.3 |
6.4 |
6.1 |
6.0 |
6.4 |
7.3 |
6.4 |
5.5 |
|
Arsenic |
0.07 |
0.005 |
0.005 |
0.005 |
0.005 |
0.005 |
0.006 |
0.005 |
0.005 |
|
Chromium |
0.5 |
0.006 |
0.006 |
0.006 |
0.006 |
0.006 |
0.007 |
0.006 |
0.005 |
|
Cobalt |
No value |
0.0020 |
0.0020 |
0.0023 |
0.0023 |
0.0024 |
0.0027 |
0.0024 |
0.0020 |
|
Copper |
20 |
0.0056 |
0.0056 |
0.0055 |
0.0055 |
0.0055 |
0.0066 |
0.0053 |
0.0051 |
|
Lead |
0.1 |
0.0017 |
0.0017 |
0.0019 |
0.0019 |
0.0020 |
0.0024 |
0.0021 |
0.0019 |
|
Nickel |
0.2 |
0.0068 |
0.0067 |
0.0072 |
0.0072 |
0.0074 |
0.0082 |
0.0073 |
0.0068 |
|
Zinc |
30 |
0.010 |
0.009 |
0.010 |
0.010 |
0.010 |
0.013 |
0.010 |
0.009 |
2NHMRC (2008) Guidelines for managing risks in recreational waters (10 x drinking water guideline value, Table 9.3)
|
Metal in Water |
ANZG 20183 |
Samples from the Menindee Weir Pools along the Darling-Barka River (dissolved metals) |
|||||||
|---|---|---|---|---|---|---|---|---|---|
|
Water Quality Guideline for aquatic ecosystems (95% species protection) |
1 |
2* |
3 |
4 |
5 |
6 |
7 |
8 |
|
|
(mg/L) |
(mg/L) |
(mg/L) |
(mg/L) |
(mg/L) |
(mg/L) |
(mg/L) |
(mg/L) |
(mg/L) |
|
|
Aluminium |
0.055 |
<0.04 |
nm |
<0.04 |
<0.04 |
<0.04 |
<0.04 |
<0.04 |
<0.04 |
|
Arsenic |
0.013 |
0.002 |
nm |
0.004 |
0.004 |
0.004 |
0.004 |
0.005 |
0.006 |
|
Cadmium |
0.0002 |
<0.0001 |
nm |
<0.0001 |
<0.0001 |
<0.0001 |
<0.0001 |
<0.0001 |
<0.0001 |
|
Chromium |
0.001 |
<0.001 |
nm |
<0.001 |
<0.001 |
<0.001 |
<0.001 |
<0.001 |
<0.001 |
|
Cobalt |
No value |
0.0003 |
nm |
0.0002 |
0.0002 |
0.0002 |
0.0002 |
0.0002 |
0.0001 |
|
Copper |
0.0014 |
0.0010 |
nm |
0.0023 |
0.0022 |
0.0020 |
0.0020 |
0.0023 |
0.0028 |
|
Lead |
0.0034 |
<0.0001 |
nm |
<0.0001 |
<0.0001 |
<0.0001 |
<0.0001 |
<0.0001 |
<0.0001 |
|
Manganese |
1.9 |
<0.001 |
nm |
<0.001 |
<0.001 |
<0.001 |
<0.001 |
<0.001 |
<0.001 |
|
Nickel |
0.011 |
0.0032 |
nm |
0.0032 |
0.0036 |
0.0034 |
0.0035 |
0.0029 |
0.0024 |
|
Selenium |
0.005 |
<0.005 |
nm |
<0.005 |
<0.005 |
<0.005 |
<0.005 |
<0.005 |
<0.005 |
|
Silver |
0.0005 |
<0.0001 |
nm |
<0.0001 |
<0.0001 |
<0.0001 |
<0.0001 |
<0.0001 |
<0.0001 |
|
Zinc |
0.008 |
<0.001 |
nm |
<0.001 |
<0.001 |
<0.001 |
<0.001 |
<0.001 |
0.001 |
3ANZG (2018). Australian and New Zealand Guidelines for Fresh and Marine Water Quality. Australian and New Zealand Governments and Australian state and territory governments, Canberra ACT, Australia.
*Please note, sample 2 was not measured (nm) because of damage to the sample on arrival at the laboratory.
|
Metal in Water |
ANZG 20183 |
Samples from the Great Darling Anabranch region (dissolved metals) |
|||
|---|---|---|---|---|---|
|
Water Quality Guideline for aquatic ecosystems (95% species protection) |
9 |
10 |
11 |
12 |
|
|
(mg/L) |
(mg/L) |
(mg/L) |
(mg/L) |
(mg/L) |
|
|
Aluminium |
0.055 |
<0.04 |
<0.04 |
<0.04 |
<0.04 |
|
Arsenic |
0.013 |
0.007 |
0.004 |
0.007 |
0.007 |
|
Cadmium |
0.0002 |
<0.0001 |
<0.0001 |
<0.0001 |
<0.0001 |
|
Chromium |
0.001 |
<0.001 |
<0.001 |
<0.001 |
<0.001 |
|
Cobalt |
No value |
<0.0001 |
0.0005 |
0.0003 |
0.0002 |
|
Copper |
0.0014 |
0.0023 |
0.0018 |
0.0018 |
0.0020 |
|
Lead |
0.0034 |
<0.0001 |
<0.0001 |
<0.0001 |
<0.0001 |
|
Manganese |
1.9 |
<0.001 |
0.001 |
<0.001 |
<0.001 |
|
Nickel |
0.011 |
0.0021 |
0.0024 |
0.0018 |
0.0024 |
|
Selenium |
0.005 |
<0.005 |
<0.005 |
<0.005 |
<0.005 |
|
Silver |
0.0005 |
<0.0001 |
<0.0001 |
<0.0001 |
<0.0001 |
|
Zinc |
0.008 |
<0.001 |
<0.001 |
<0.001 |
0.001 |
3ANZG (2018). Australian and New Zealand Guidelines for Fresh and Marine Water Quality. Australian and New Zealand Governments and Australian state and territory governments, Canberra ACT, Australia.
|
Metal in Water |
ANZG 20183 |
Samples from the lower Darling-Barka River between Weir 32 and Pooncarie (dissolved metals) |
|||||||
|---|---|---|---|---|---|---|---|---|---|
|
Water Quality Guideline for aquatic ecosystems (95% species protection) |
13 |
14 |
15 |
16 |
17 |
18 |
19 |
20 |
|
|
(mg/L) |
(mg/L) |
(mg/L) |
(mg/L) |
(mg/L) |
(mg/L) |
(mg/L) |
(mg/L) |
(mg/L) |
|
|
Aluminium |
0.055 |
<0.04 |
<0.04 |
<0.04 |
<0.04 |
<0.04 |
<0.04 |
<0.04 |
<0.04 |
|
Arsenic |
0.013 |
0.005 |
0.005 |
0.005 |
0.005 |
0.005 |
0.005 |
0.005 |
0.004 |
|
Cadmium |
0.0002 |
<0.0001 |
<0.0001 |
<0.0001 |
<0.0001 |
<0.0001 |
<0.0001 |
<0.0001 |
<0.0001 |
|
Chromium |
0.001 |
<0.001 |
<0.001 |
<0.001 |
<0.001 |
<0.001 |
<0.001 |
<0.001 |
<0.001 |
|
Cobalt |
No value |
0.0002 |
0.0002 |
0.0003 |
0.0003 |
0.0003 |
0.0002 |
0.0003 |
0.0003 |
|
Copper |
0.0014 |
0.0023 |
0.0022 |
0.0022 |
0.0021 |
0.0019 |
0.0022 |
0.0019 |
0.0019 |
|
Lead |
0.0034 |
<0.0001 |
<0.0001 |
<0.0001 |
<0.0001 |
<0.0001 |
<0.0001 |
<0.0001 |
<0.0001 |
|
Manganese |
1.9 |
<0.001 |
<0.001 |
<0.001 |
<0.001 |
<0.001 |
<0.001 |
<0.001 |
<0.001 |
|
Nickel |
0.011 |
0.0030 |
0.0031 |
0.0032 |
0.0033 |
0.0033 |
0.0034 |
0.0035 |
0.0032 |
|
Selenium |
0.005 |
<0.005 |
<0.005 |
<0.005 |
<0.005 |
<0.005 |
<0.005 |
<0.005 |
<0.005 |
|
Silver |
0.0005 |
<0.0001 |
<0.0001 |
<0.0001 |
<0.0001 |
<0.0001 |
<0.0001 |
<0.0001 |
<0.0001 |
|
Zinc |
0.008 |
<0.001 |
0.002 |
<0.001 |
<0.001 |
<0.001 |
<0.001 |
<0.001 |
<0.001 |
3ANZG (2018). Australian and New Zealand Guidelines for Fresh and Marine Water Quality. Australian and New Zealand Governments and Australian state and territory governments, Canberra ACT, Australia.
References
ANZG (2018), Australian and New Zealand Guidelines for Fresh and Marine Water Quality, Australian and New Zealand Governments and Australian state and territory governments, Canberra ACT, Australia. Available at www.waterquality.gov.au/anz-guidelines
Basin Plan (2012), Schedule 11, Water Act 2007, Murray-Darling Basin Authority, Commonwealth of Australia
NHMRC (2008), Guidelines for managing risks in recreational waters, Australian Government National Health and Medical Research Council
Download the full test results
30 May results
- Report for metals and pesticides – 30 May, Menindee weir pools (PDF 189KB)
- Report for algal toxins – 30 May, Menindee weir pools (PDF 197KB)
- Report for algal identification and cell count – 30 May, Menindee weir pools (PDF 228KB)
- Report for glyphosate and phenoxyherbicides – 30 May, Menindee weir pools (PDF 711KB)
- Report for nutrients – 30 May, Menindee weir pools (PDF 718KB)
31 May results
- Report for metals and pesticides – 31 May, Great Darling Anabranch and Lower Darling-Barka River (PDF 168KB)
- Report for algal toxins – 31 May, Great Darling Anabranch and Lower Darling-Barka River (PDF 198KB)
- Report for algal identification and cell count – 31 May, Great Darling Anabranch and Lower Darling-Barka River (PDF 230KB)
- Report for glyphosate and phenoxyherbicides – 31 May, Great Darling Anabranch and Lower Darling-Barka River (PDF 711KB)
- Report for nutrients – 31 May, Great Darling Anabranch and Lower Darling-Barka River (PDF 713KB)
1 June results
- Report for metals and pesticides – 1 June, Lower Darling-Barka River (PDF 165KB)
- Report for algal toxins – 1 June, Lower Darling-Barka River (PDF 177KB)
- Report for algal identification and cell count – 1 June, Lower Darling-Barka River (PDF 226KB)
- Report for glyphosate and phenoxyherbicides – 1 June, Lower Darling-Barka River (PDF 699KB)
- Report for nutrients – 1 June, Lower Darling-Barka River (PDF 698KB)
The Department of Planning and Environment (DPE) and the NSW Environment Protection Authority (EPA) collected twenty water samples between 23 and 25 May 2023 at Menindee along the Darling-Barka River, downstream along the lower Darling-Barka River, and along the Great Darling Anabranch.
Samples were checked for pesticides, excess nitrogen and phosphorus, ammonia, metals, algae and algal toxins.
Summary
Pesticides
Samples were scanned for more than 600 pesticides. None were detected.
Nitrogen and phosphorus
Nitrogen and phosphorous levels are high. If nitrogen and phosphorus stay high they can cause algal blooms.
Algae and algal toxins
Blue-green algae were detected in all samples, but potentially toxic blue-green algae were detected in 14 of the samples. The algal toxin Cylindrospermopsin was detected in 10 samples across all regions.
A ‘red alert’ is in place along parts of the lower Darling-Barka River and just downstream of Menindee. An ‘amber alert’ is in place along the Great Darling Anabranch and along the Darling-Barka River, at Menindee and further downstream, as of 25 July 2023. See WaterNSW for information about red alerts
Metals
Copper was slightly above the level set to protect water life in most samples across all 3 regions, but well below the level harmful to fish. All other metals were under the levels set to protect water life.
Sample locations
Water was sampled between 23 and 25 May 2023 from twenty locations on the Darling-Barka River at Menindee, downstream along the lower Darling-Barka River, and along the Great Darling Anabranch.
On 23 May 2023, eight samples were collected from the Menindee Weir Pools in the Darling-Barka River. The correlating sample identifications are given in brackets for reference to the full laboratory report data.
- Sample 1 (B1) – Lake Wetherell upstream of the Main Weir
- Sample 2 (B2) – Outlet of Lake Pamamaroo into Darling River
- Sample 3 (E1) – Upper weir pool
- Sample 4 (E2) – Mid weir pool
- Sample 5 (E3) – Menindee town
- Sample 6 (E4) – Downstream Menindee town
- Sample 7 (E5) – Lower weir pool downstream Lake Menindee inflow
- Sample 8 (B3) – Outlet of Lake Menindee into Darling-Barka River
On 24 May 2023, four samples were collected from the Great Darling Anabranch region and three samples from the Lower Darling-Barka River between Weir 32 and Pooncarie.
- Sample 9 (B4) – Lake Cawndilla outlet into the anabranch of Darling River
- Sample 10 (E6) – Redbank Creek upstream of Cawndilla Channel confluence
- Sample 11 (E6.5) – Tandou Creek at Tandou Woolshed Rd (incorporating inflows from Kangaroo Lake)
- Sample 12 (E7) – Tandou Creek at Packers Crossing (incorporating inflows from Packers Lake)
- Sample 13 (E8) – Kinchega National Park upper
- Sample 14 (E9) – Kinchega National Park mid (incorporating inflows from Emu Lake)
- Sample 15 (E10) – Kinchega National Park lower (upstream of Anabranch offtake)
On 25 May 2023, five samples were collected from the Lower Darling-Barka River between Weir 32 and Pooncarie.
- Sample 16 (E11) – Bindara Station reach
- Sample 17 (E12) – Karoola Station reach
- Sample 18 (E13) – Coona Point reach
- Sample 19 (E14) – Mullingar Station reach
- Sample 20 (E15) – Old wharf at Pooncarie


More sampling
The DPE and EPA are conducting regular water quality monitoring on the Darling-Barka River from upstream of Menindee to Pooncarie as well as the Great Darling Anabranch. The test results from these samples will also be published on this website.
In-field measurements
At the time of sampling, the EPA collected in-field measurements for pH, dissolved oxygen, conductivity, temperature and turbidity.
pH was outside the guideline value for all samples in the Great Darling Anabranch region.
All other parameters were within the expected ranges.
|
Sample |
Location |
Temp (°C) |
Dissolved oxygen (mg/L) |
Electrical conductivity (µS/cm) |
pH |
Turbidity (NTU) |
|---|---|---|---|---|---|---|
|
1 (B1) |
Lake Wetherell upstream of the Main Weir |
13.8 |
6.6 |
556 |
8.2 |
8.1 |
|
2 (B2) |
Outlet of Lake Pamamaroo into Darling River |
13.4 |
10.1 |
384 |
8.5 |
35.7 |
|
3 (E1) |
Upper weir pool |
13.5 |
9.4 |
394 |
8.2 |
35.8 |
|
4 (E2) |
Mid weir pool |
13.6 |
8.2 |
394 |
8.3 |
39.8 |
|
5 (E3) |
Menindee town |
14.6 |
6.6 |
410 |
8.1 |
38.0 |
|
6 (E4) |
Downstream Menindee town |
13.3 |
4.8 |
398 |
7.9 |
55.0 |
|
7 (E5) |
Lower weir pool downstream Lake Menindee inflow |
13.5 |
7.6 |
367 |
8.1 |
52.1 |
|
8 (B3) |
Outlet of Lake Menindee into Darling-Barka River |
13.1 |
10.3 |
325 |
8.5 |
55.1 |
|
9 (B4) |
Lake Cawndilla outlet into the anabranch of Darling River |
15.1 |
10.1 |
370 |
8.6 |
19.5 |
|
10 (E6) |
Redbank Creek upstream of Cawndilla Channel confluence |
15.1 |
13.0 |
389 |
9.1 |
21.3 |
|
11 (E6.5) |
Tandou Creek at Tandou Woolshed Rd (incorporating inflows from Kangaroo Lake) |
14.3 |
13.0 |
362 |
9.0 |
19.6 |
|
12 (E7) |
Tandou Creek at Packers Crossing (incorporating inflows from Packers Lake) |
14.3 |
10.1 |
372 |
8.8 |
38.2 |
|
13 (E8) |
Kinchega National Park upper |
12.8 |
8.6 |
362 |
8.1 |
49.9 |
|
14 (E9) |
Kinchega National Park mid (incorporating inflows from Emu Lake) |
12.4 |
8.7 |
359 |
8.1 |
54.2 |
|
15 (E10) |
Kinchega National Park lower (upstream of Anabranch offtake) |
12.3 |
8.4 |
369 |
8.1 |
53.1 |
|
16 (E11) |
Bindara Station reach |
12.9 |
8.7 |
376 |
8.0 |
58.4 |
|
17 (E12) |
Karoola Station reach |
12.7 |
8.1 |
378 |
8.0 |
54.2 |
|
18 (E13) |
Coona Point reach |
12.4 |
8.4 |
383 |
7.9 |
48.8 |
|
19 (E14) |
Mullingar Station reach |
12.4 |
9.2 |
379 |
8.0 |
46.4 |
|
20 (E15) |
Old wharf at Pooncarie |
12.5 |
9.3 |
379 |
8.1 |
46.5 |
Nitrogen, phosphorus and ammonia
Sample results show that total nitrogen and total phosphorous are higher than the acceptable levels given for lowland river ecosystems in NSW (ANZG 2018, which are in agreement with the regionally specific set of guideline values for the Murray-Darling outlined in the Basin Plan 2012). Total nitrogen was detected at up to three times higher than the guideline value while total phosphorous was detected at up to seven times higher. Algal blooms are possible if these nutrients remain elevated.
Bacteria convert nitrogen compounds such as ammonia into nitrite and nitrate. These compounds can harm aquatic organisms. Ammonia was well below the Australian and New Zealand water quality guidelines for toxicity. While the levels would not be expected to be harmful to fish, the ammonia could promote growth in algae and macrophytes. The ammonia is likely to be from river sources including rotting fish and flood organic matter rather than diffuse inputs from surrounding land.
Algae and algal toxins
There were positive detections in all samples for blue-green algae. However, only the blue-green algae detections found in samples 1, 2, 4, 8 to 11 and 14 to 20 were considered potentially toxic. The algal toxin Cylindrospermopsin was detected in samples 1, 10, 11, 14, 15 and 16 to 20.
The algae levels detected fall within the ‘amber’ to ‘red’ alert levels. A ‘red alert’ is in place along parts of the lower Darling-Barka River and just downstream of Menindee. An ‘amber alert’ is in place along the Great Darling Anabranch and along the Darling-Barka River, at Menindee and further downstream, as of 25 July 2023.
Pesticides
As noted above, a pesticide screening test that scanned for over 600 pesticides was completed for samples from all three regions. All samples came back negative for pesticide detection.
Metals
Many metals are vital for humans and animals to stay healthy and only pose a risk if they are found at high levels in the environment. Concentrations of key metals found in water are below.
Total metals have been compared to recreational water quality guidelines and dissolved metals have been compared to ecological water quality guidelines as per the National Health and Medical Research Council (NHMRC) recreational and Australian and New Zealand Water Quality (ANZG) guidelines, respectively.
Total metals provide a more conservative estimate of exposure from recreational use whereas dissolved metals are used for ecological assessments as this is the bioavailable fraction of the metal (the part that is toxic to organisms).
|
Metal in Water |
NHMRC (2008)2 |
Samples from the Menindee Weir Pools along the Darling-Barka River (total acid-extractable metals) |
|||||||
|---|---|---|---|---|---|---|---|---|---|
|
Recreational Water Guidelines |
1 |
2 |
3 |
4 |
5 |
6 |
7 |
8 |
|
|
(mg/L) |
(mg/L) |
(mg/L) |
(mg/L) |
(mg/L) |
(mg/L) |
(mg/L) |
(mg/L) |
(mg/L) |
|
|
Aluminium |
No value |
0.75 |
4.3 |
4.2 |
4.3 |
4.3 |
4.4 |
5.6 |
5.8 |
|
Arsenic |
0.07 |
0.002 |
0.004 |
0.004 |
0.004 |
0.004 |
0.004 |
0.005 |
0.006 |
|
Chromium |
0.5 |
<0.001 |
0.004 |
0.004 |
0.004 |
0.004 |
0.004 |
0.005 |
0.006 |
|
Cobalt |
No value |
0.0010 |
0.0015 |
0.0016 |
0.0017 |
0.0019 |
0.0017 |
0.0017 |
0.0014 |
|
Copper |
20 |
0.0020 |
0.0047 |
0.0046 |
0.0048 |
0.0044 |
0.0042 |
0.0051 |
0.0058 |
|
Lead |
0.1 |
0.0005 |
0.0008 |
0.0009 |
0.0009 |
0.0010 |
0.0010 |
0.0011 |
0.0009 |
|
Nickel |
0.2 |
0.0037 |
0.0060 |
0.0061 |
0.0064 |
0.0062 |
0.0063 |
0.0062 |
0.0060 |
|
Zinc |
30 |
0.004 |
0.006 |
0.007 |
0.007 |
0.009 |
0.007 |
0.009 |
0.009 |
2NHMRC (2008) Guidelines for managing risks in recreational waters (10 x drinking water guideline value, Table 9.3)
|
Metal in Water |
NHMRC (2008)2 |
Samples from the Great Darling Anabranch region (total acid-extractable metals) |
|||
|---|---|---|---|---|---|
|
Recreational Water Guidelines |
9 |
10 |
11 |
12 |
|
|
(mg/L) |
(mg/L) |
(mg/L) |
(mg/L) |
(mg/L) |
|
|
Aluminium |
No value |
2.3 |
2.0 |
2.1 |
4.6 |
|
Arsenic |
0.07 |
0.007 |
0.005 |
0.007 |
0.007 |
|
Chromium |
0.5 |
0.002 |
0.002 |
0.002 |
0.004 |
|
Cobalt |
No value |
0.0005 |
0.0015 |
0.0007 |
0.0014 |
|
Copper |
20 |
0.0040 |
0.0035 |
0.0040 |
0.0048 |
|
Lead |
0.1 |
0.0004 |
0.0006 |
0.0005 |
0.0011 |
|
Nickel |
0.2 |
0.0038 |
0.0042 |
0.0038 |
0.0053 |
|
Zinc |
30 |
0.005 |
0.005 |
0.006 |
0.009 |
2NHMRC (2008) Guidelines for managing risks in recreational waters (10 x drinking water guideline value, Table 9.3)
|
Metal in Water |
NHMRC (2008)2 |
Samples from the lower Darling-Barka River between Weir 32 and Pooncarie (total acid-extractable metals) |
|||||||
|---|---|---|---|---|---|---|---|---|---|
|
Recreational Water Guidelines |
13 |
14 |
15 |
16 |
17 |
18 |
19 |
20 |
|
|
(mg/L) |
(mg/L) |
(mg/L) |
(mg/L) |
(mg/L) |
(mg/L) |
(mg/L) |
(mg/L) |
(mg/L) |
|
|
Aluminium |
No value |
5.7 |
6.2 |
6.2 |
5.9 |
5.9 |
5.5 |
5.5 |
5.2 |
|
Arsenic |
0.07 |
0.005 |
0.005 |
0.005 |
0.004 |
0.006 |
0.005 |
0.005 |
0.005 |
|
Chromium |
0.5 |
0.006 |
0.006 |
0.006 |
0.006 |
0.006 |
0.006 |
0.006 |
0.005 |
|
Cobalt |
No value |
0.0018 |
0.0021 |
0.0024 |
0.0022 |
0.0023 |
0.0023 |
0.0022 |
0.0021 |
|
Copper |
20 |
0.0055 |
0.0059 |
0.0056 |
0.0053 |
0.0054 |
0.0056 |
0.0050 |
0.0048 |
|
Lead |
0.1 |
0.0012 |
0.0014 |
0.0014 |
0.0014 |
0.0014 |
0.0014 |
0.0014 |
0.0014 |
|
Nickel |
0.2 |
0.0068 |
0.0073 |
0.0074 |
0.0073 |
0.0074 |
0.0075 |
0.0073 |
0.0070 |
|
Zinc |
30 |
0.014 |
0.011 |
0.011 |
0.011 |
0.010 |
0.011 |
0.011 |
0.009 |
2NHMRC (2008) Guidelines for managing risks in recreational waters (10 x drinking water guideline value, Table 9.3)
|
Metal in Water |
ANZG 20183 |
Samples from the Menindee Weir Pools along the Darling-Barka River (dissolved metals) |
|||||||
|---|---|---|---|---|---|---|---|---|---|
|
Water Quality Guideline for aquatic ecosystems (95% species protection) |
1 |
2 |
3 |
4 |
5 |
6 |
7 |
8 |
|
|
(mg/L) |
(mg/L) |
(mg/L) |
(mg/L) |
(mg/L) |
(mg/L) |
(mg/L) |
(mg/L) |
(mg/L) |
|
|
Aluminium |
0.055 |
<0.04 |
<0.04 |
<0.04 |
<0.04 |
<0.04 |
<0.04 |
<0.04 |
<0.04 |
|
Arsenic |
0.013 |
0.002 |
0.004 |
0.004 |
0.004 |
0.004 |
0.003 |
0.005 |
0.006 |
|
Cadmium |
0.0002 |
<0.0001 |
<0.0001 |
<0.0001 |
<0.0001 |
<0.0001 |
<0.0001 |
<0.0001 |
<0.0001 |
|
Chromium |
0.001 |
<0.001 |
<0.001 |
<0.001 |
<0.001 |
<0.001 |
<0.001 |
<0.001 |
<0.001 |
|
Cobalt |
No value |
0.0002 |
0.0002 |
0.0002 |
0.0002 |
0.0002 |
0.0002 |
0.0001 |
0.0001 |
|
Copper |
0.0014 |
0.0010 |
0.0024 |
0.0025 |
0.0024 |
0.0021 |
0.0020 |
0.0023 |
0.0028 |
|
Lead |
0.0034 |
<0.0001 |
<0.0001 |
<0.0001 |
<0.0001 |
<0.0001 |
<0.0001 |
<0.0001 |
<0.0001 |
|
Manganese |
1.9 |
<0.001 |
<0.001 |
<0.001 |
<0.001 |
<0.001 |
<0.001 |
<0.001 |
<0.001 |
|
Nickel |
0.011 |
0.0027 |
0.0033 |
0.0034 |
0.0034 |
0.0036 |
0.0035 |
0.0029 |
0.0022 |
|
Selenium |
0.005 |
<0.005 |
<0.005 |
<0.005 |
<0.005 |
<0.005 |
<0.005 |
<0.005 |
<0.005 |
|
Silver |
0.0005 |
<0.0001 |
<0.0001 |
<0.0001 |
<0.0001 |
<0.0001 |
<0.0001 |
<0.0001 |
<0.0001 |
|
Zinc |
0.008 |
0.002 |
<0.001 |
<0.001 |
<0.001 |
<0.001 |
<0.001 |
<0.001 |
<0.001 |
3ANZG (2018). Australian and New Zealand Guidelines for Fresh and Marine Water Quality. Australian and New Zealand Governments and Australian state and territory governments, Canberra ACT, Australia.
|
Metal in Water |
ANZG 20183 |
Samples from the Great Darling Anabranch region (dissolved metals) |
|||
|---|---|---|---|---|---|
|
Water Quality Guideline for aquatic ecosystems |
9 |
10 |
11 |
12 |
|
|
(mg/L) |
(mg/L) |
(mg/L) |
(mg/L) |
(mg/L) |
|
|
Aluminium |
0.055 |
<0.04 |
<0.04 |
<0.04 |
<0.04 |
|
Arsenic |
0.013 |
0.007 |
0.005 |
0.007 |
0.007 |
|
Cadmium |
0.0002 |
<0.0001 |
<0.0001 |
<0.0001 |
<0.0001 |
|
Chromium |
0.001 |
<0.001 |
<0.001 |
<0.001 |
<0.001 |
|
Cobalt |
No value |
<0.0001 |
0.0007 |
0.0002 |
0.0002 |
|
Copper |
0.0014 |
0.0026 |
0.0018 |
0.0024 |
0.0022 |
|
Lead |
0.0034 |
<0.0001 |
<0.0001 |
<0.0001 |
<0.0001 |
|
Manganese |
1.9 |
<0.001 |
<0.001 |
<0.001 |
<0.001 |
|
Nickel |
0.011 |
0.0023 |
0.0025 |
0.0022 |
0.0023 |
|
Selenium |
0.005 |
<0.005 |
<0.005 |
<0.005 |
<0.005 |
|
Silver |
0.0005 |
<0.0001 |
<0.0001 |
<0.0001 |
<0.0001 |
|
Zinc |
0.008 |
0.001 |
0.001 |
0.002 |
<0.001 |
3ANZG (2018). Australian and New Zealand Guidelines for Fresh and Marine Water Quality. Australian and New Zealand Governments and Australian state and territory governments, Canberra ACT, Australia.
|
Metal in Water |
ANZG 20183 |
Samples from the lower Darling-Barka River between Weir 32 and Pooncarie (dissolved metals) |
|||||||
|---|---|---|---|---|---|---|---|---|---|
|
Water Quality Guideline for aquatic ecosystems (95% species protection) |
13 |
14 |
15 |
16 |
17 |
18 |
19 |
20 |
|
|
(mg/L) |
(mg/L) |
(mg/L) |
(mg/L) |
(mg/L) |
(mg/L) |
(mg/L) |
(mg/L) |
(mg/L) |
|
|
Aluminium |
0.055 |
<0.04 |
<0.04 |
<0.04 |
<0.04 |
<0.04 |
<0.04 |
<0.04 |
<0.04 |
|
Arsenic |
0.013 |
0.005 |
0.005 |
0.005 |
0.004 |
0.005 |
0.005 |
0.005 |
0.005 |
|
Cadmium |
0.0002 |
<0.0001 |
<0.0001 |
<0.0001 |
<0.0001 |
<0.0001 |
<0.0001 |
<0.0001 |
<0.0001 |
|
Chromium |
0.001 |
<0.001 |
<0.001 |
<0.001 |
<0.001 |
<0.001 |
<0.001 |
<0.001 |
<0.001 |
|
Cobalt |
No value |
0.0001 |
0.0002 |
0.0003 |
0.0003 |
0.0003 |
0.0003 |
0.0003 |
0.0003 |
|
Copper |
0.0014 |
0.0024 |
0.0023 |
0.0024 |
0.0022 |
0.0021 |
0.0023 |
0.0019 |
0.0020 |
|
Lead |
0.0034 |
<0.0001 |
<0.0001 |
<0.0001 |
<0.0001 |
<0.0001 |
<0.0001 |
<0.0001 |
<0.0001 |
|
Manganese |
1.9 |
<0.001 |
<0.001 |
<0.001 |
<0.001 |
<0.001 |
<0.001 |
<0.001 |
<0.001 |
|
Nickel |
0.011 |
0.0029 |
0.0030 |
0.0033 |
0.0035 |
0.0033 |
0.0036 |
0.0034 |
0.0038 |
|
Selenium |
0.005 |
<0.005 |
<0.005 |
<0.005 |
<0.005 |
<0.005 |
<0.005 |
<0.005 |
<0.005 |
|
Silver |
0.0005 |
<0.0001 |
<0.0001 |
<0.0001 |
<0.0001 |
<0.0001 |
<0.0001 |
<0.0001 |
<0.0001 |
|
Zinc |
0.008 |
0.002 |
<0.001 |
0.001 |
<0.001 |
<0.001 |
<0.001 |
<0.001 |
<0.001 |
3ANZG (2018). Australian and New Zealand Guidelines for Fresh and Marine Water Quality. Australian and New Zealand Governments and Australian state and territory governments, Canberra ACT, Australia.
References
ANZG (2018), Australian and New Zealand Guidelines for Fresh and Marine Water Quality, Australian and New Zealand Governments and Australian state and territory governments, Canberra ACT, Australia. Available at www.waterquality.gov.au/anz-guidelines
Basin Plan (2012), Schedule 11, Water Act 2007, Murray-Darling Basin Authority, Commonwealth of Australia
NHMRC (2008), Guidelines for managing risks in recreational waters, Australian Government National Health and Medical Research Council
Download the full test results
23 May results
- Report for metals and pesticides – 23 May, Menindee weir pools (PDF 189KB)
- Report for algal toxins – 23 May, Menindee weir pools (PDF 197KB)
- Report for algal identification and cell count – 23 May, Menindee weir pools (PDF 228KB)
- Report for glyphosate and phenoxyherbicides – 23 May, Menindee weir pools (PDF 711KB)
- Report for nutrients – 23 May, Menindee weir pools (PDF 718KB)
24 May results
- Report for metals and pesticides – 24 May, Great Darling Anabranch and Lower Darling-Barka River (PDF 168KB)
- Report for algal toxins – 24 May, Great Darling Anabranch and Lower Darling-Barka River (PDF 198KB)
- Report for algal identification and cell count – 24 May, Great Darling Anabranch and Lower Darling-Barka River (PDF 230KB)
- Report for glyphosate and phenoxyherbicides – 24 May, Great Darling Anabranch and Lower Darling-Barka River (PDF 711KB)
- Report for nutrients – 24 May, Great Darling Anabranch and Lower Darling-Barka River (PDF 713KB)
25 May results
- Report for metals and pesticides – 25 May, Lower Darling-Barka River (PDF 176KB)
- Report for algal toxins – 25 May, Lower Darling-Barka River (PDF 192KB)
- Report for algal identification and cell count – 25 May, Lower Darling-Barka River (PDF 217KB)
- Report for glyphosate and phenoxyherbicides – 25 May, Lower Darling-Barka River (PDF 708KB)
- Report for nutrients – 25 May, Lower Darling-Barka River (PDF 709KB)
The Department of Planning and Environment (DPE) and the NSW Environment Protection Authority (EPA) collected twenty water samples between 16 and 18 May 2023 at Menindee along the Darling-Barka River, downstream along the lower Darling-Barka River, and along the Great Darling Anabranch.
Samples were checked for pesticides, excess nitrogen and phosphorus, ammonia, metals, algae and algal toxins.
Summary
Pesticides
Samples were scanned for more than 600 pesticides. None were detected.
Nitrogen and phosphorus
Nitrogen and phosphorous levels are high. If nitrogen and phosphorus stay high they can cause algal blooms.
Algae and algal toxins
Blue-green algae were detected in all samples, but potentially toxic blue-green algae were detected in eleven of the samples. The algal toxin Cylindrospermopsin was detected in nine samples across all regions.
A ‘red alert’ is in place along parts of the lower Darling-Barka River. An ‘amber alert’ is in place along the Great Darling Anabranch and along the Darling-Barka River, at Menindee and further downstream, as of 10 July 2023. See WaterNSW for information about red alerts
Metals
Copper was slightly above the level set to protect water life in most samples across all 3 regions, but well below the level harmful to fish. All other metals were under the levels set to protect water life.
Sample locations
Water was sampled between 16 and 18 May 2023 from twenty locations on the Darling-Barka River at Menindee, downstream along the lower Darling-Barka River, and along the Great Darling Anabranch.
On 16 May 2023, eight samples were collected from the Menindee Weir Pools in the Darling-Barka River. The correlating sample identifications are given in brackets for reference to the full laboratory report data.
- Sample 1 (B1) – Lake Wetherell upstream of the Main Weir
- Sample 2 (B2) – Outlet of Lake Pamamaroo into Darling River
- Sample 3 (E1) – Upper weir pool
- Sample 4 (E2) – Mid weir pool
- Sample 5 (E3) – Menindee town
- Sample 6 (E4) – Downstream Menindee town
- Sample 7 (E5) – Lower weir pool downstream Lake Menindee inflow
- Sample 8 (B3) – Outlet of Lake Menindee into Darling-Barka River
On 17 May 2023, four samples were collected from the Great Darling Anabranch region and three samples from the Lower Darling-Barka River between Weir 32 and Pooncarie.
- Sample 9 (B4) – Lake Cawndilla outlet into the anabranch of Darling River
- Sample 10 (E6) – Redbank Creek upstream of Cawndilla Channel confluence
- Sample 11 (E6.5) – Tandou Creek at Tandou Woolshed Rd (incorporating inflows from Kangaroo Lake)
- Sample 12 (E7) – Tandou Creek at Packers Crossing (incorporating inflows from Packers Lake)
- Sample 13 (E8) – Kinchega National Park upper
- Sample 14 (E9) – Kinchega National Park mid (incorporating inflows from Emu Lake)
- Sample 15 (E10) – Kinchega National Park lower (upstream of Anabranch offtake)
On 18 May 2023, five samples were collected from the Lower Darling-Barka River between Weir 32 and Pooncarie.
- Sample 16 (E11) – Bindara Station reach
- Sample 17 (E12) – Karoola Station reach
- Sample 18 (E13) – Coona Point reach
- Sample 19 (E14) – Mullingar Station reach
- Sample 20 (E15) – Old wharf at Pooncarie
Figure 1: Sample locations where samples were taken between 16 to 18 May 2023. See Figures 2 and 3 below for more detail.

Figure 2: Sample locations for the Menindee Weir Pools region along the Darling-Barka River

Figure 3: Sample locations for the Great Darling Anabranch and lower Darling-Barka river between Weir 32 and Pooncarie regions

More sampling
The DPE and EPA are conducting regular water quality monitoring on the Darling-Barka River from upstream of Menindee to Pooncarie as well as the Great Darling Anabranch. The test results from these samples will also be published on this website.
In-field measurements
At the time of sampling, the EPA collected in-field measurements for pH, dissolved oxygen, conductivity, temperature and turbidity.
pH was outside the guideline value for all samples in the Menindee Weir Pool and Great Darling Anabranch regions.
All other parameters were within the expected ranges.
|
Sample |
Location |
Temp (°C) |
Dissolved oxygen (mg/L) |
Electrical conductivity (µS/cm) |
pH |
Turbidity (NTU) |
|---|---|---|---|---|---|---|
|
1 (B1) |
Lake Wetherell upstream of the Main Weir |
15.9 |
10.3 |
557 |
8.6 |
6.9 |
|
2 (B2) |
Outlet of Lake Pamamaroo into Darling River |
14.7 |
9.5 |
400 |
8.5 |
36.8 |
|
3 (E1) |
Upper weir pool |
15.1 |
8.7 |
411 |
8.4 |
34.6 |
|
4 (E2) |
Mid weir pool |
14.5 |
7.9 |
401 |
8.3 |
40.2 |
|
5 (E3) |
Menindee town |
14.9 |
7.1 |
412 |
8.3 |
34.7 |
|
6 (E4) |
Downstream Menindee town |
15.0 |
6.4 |
430 |
8.2 |
32.0 |
|
7 (E5) |
Lower weir pool downstream Lake Menindee inflow |
15.0 |
7.2 |
391 |
8.2 |
46.2 |
|
8 (B3) |
Outlet of Lake Menindee into Darling-Barka River |
15.4 |
9.5 |
345 |
8.5 |
57.1 |
|
9 (B4) |
Lake Cawndilla outlet into the anabranch of Darling River |
14.4 |
9.9 |
360 |
8.6 |
20.9 |
|
10 (E6) |
Redbank Creek upstream of Cawndilla Channel confluence |
15.3 |
6.8 |
382 |
8.5 |
39.4 |
|
11 (E6.5) |
Tandou Creek at Tandou Woolshed Rd (incorporating inflows from Kangaroo Lake) |
15.2 |
11.1 |
370 |
8.7 |
23.8 |
|
12 (E7) |
Tandou Creek at Packers Crossing (incorporating inflows from Packers Lake) |
15.6 |
9.4 |
383 |
8.8 |
43.6 |
|
13 (E8) |
Kinchega National Park upper |
14.6 |
8.3 |
387 |
8.1 |
48.7 |
|
14 (E9) |
Kinchega National Park mid (incorporating inflows from Emu Lake) |
14.6 |
8.0 |
390 |
8.1 |
50.5 |
|
15 (E10) |
Kinchega National Park lower (upstream of Anabranch offtake) |
14.9 |
7.8 |
399 |
8.1 |
50.1 |
|
16 (E11) |
Bindara Station reach |
14.2 |
8.2 |
396 |
8.1 |
49.2 |
|
17 (E12) |
Karoola Station reach |
13.7 |
7.5 |
386 |
7.9 |
53.8 |
|
18 (E13) |
Coona Point reach |
13.9 |
8.1 |
391 |
8.0 |
48.5 |
|
19 (E14) |
Mullingar Station reach |
13.8 |
9.1 |
406 |
8.1 |
45.1 |
|
20 (E15) |
Old wharf at Pooncarie |
13.5 |
8.4 |
400 |
8.0 |
48.2 |
Nitrogen, phosphorus and ammonia
Sample results show that total nitrogen and total phosphorous are higher than the acceptable levels given for lowland river ecosystems in NSW (ANZG 2018, which are in agreement with the regionally specific set of guideline values for the Murray-Darling outlined in the Basin Plan 2012). Total nitrogen was detected at three times higher than the guideline value while total phosphorous was detected at seven times higher. Algal blooms are possible if these nutrients remain elevated.
Bacteria convert nitrogen compounds such as ammonia into nitrite and nitrate. These compounds can harm aquatic organisms. Ammonia was well below the Australian and New Zealand water quality guidelines for toxicity. While the levels would not be expected to be harmful to fish, the ammonia could promote growth in algae and macrophytes. The ammonia is likely to be from river sources including rotting fish and flood organic matter rather than diffuse inputs from surrounding land.
Algae and algal toxins
There were positive detections in all samples for blue-green algae. However, only the blue-green algae detections found in samples 1, 9 and 12 to 20 were considered potentially toxic. The algal toxin Cylindrospermopsin was detected in samples 1, 10 and 14 to 20.
The algae levels detected fall within the ‘amber’ to ‘red’ alert levels. A ‘red alert’ is in place along parts of the lower Darling-Barka River. An ‘amber alert’ is in place along the Great Darling Anabranch and along the Darling-Barka River, at Menindee and further downstream, as of 10 July 2023.
Pesticides
As noted above, a pesticide screening test that scanned for over 600 pesticides was completed for samples from all three regions. All samples came back negative for pesticide detection.
Metals
Many metals are vital for humans and animals to stay healthy and only pose a risk if they are found at high levels in the environment. Concentrations of key metals found in water are below.
Total metals have been compared to recreational water quality guidelines and dissolved metals have been compared to ecological water quality guidelines as per the National Health and Medical Research Council (NHMRC) recreational and Australian and New Zealand Water Quality (ANZG) guidelines, respectively.
Total metals provide a more conservative estimate of exposure from recreational use whereas dissolved metals are used for ecological assessments as this is the bioavailable fraction of the metal (the part that is toxic to organisms).
|
Metal in Water |
NHMRC (2008)2 |
Samples from the Menindee Weir Pools along the Darling-Barka River (total acid-extractable metals) |
|||||||
|---|---|---|---|---|---|---|---|---|---|
|
Recreational Water Guidelines |
1 |
2 |
3 |
4 |
5 |
6 |
7 |
8 |
|
|
(mg/L) |
(mg/L) |
(mg/L) |
(mg/L) |
(mg/L) |
(mg/L) |
(mg/L) |
(mg/L) |
(mg/L) |
|
|
Aluminium |
No value |
0.64 |
4.0 |
4.0 |
5.0 |
4.3 |
3.7 |
6.2 |
6.8 |
|
Arsenic |
0.07 |
0.002 |
0.004 |
0.004 |
0.004 |
0.004 |
0.004 |
0.005 |
0.006 |
|
Chromium |
0.5 |
<0.001 |
0.003 |
0.003 |
0.004 |
0.004 |
0.003 |
0.005 |
0.005 |
|
Cobalt |
No value |
0.0008 |
0.0015 |
0.0015 |
0.0017 |
0.0017 |
0.0016 |
0.0017 |
0.0014 |
|
Copper |
20 |
0.0016 |
0.0065 |
0.0041 |
0.0044 |
0.0040 |
0.0036 |
0.0047 |
0.0054 |
|
Lead |
0.1 |
0.0004 |
0.0008 |
0.0007 |
0.0010 |
0.0010 |
0.0010 |
0.0012 |
0.0010 |
|
Nickel |
0.2 |
0.0033 |
0.0056 |
0.0058 |
0.0060 |
0.0058 |
0.0053 |
0.0061 |
0.0057 |
|
Zinc |
30 |
0.002 |
0.007 |
0.006 |
0.008 |
0.030 |
0.015 |
0.008 |
0.008 |
2NHMRC (2008) Guidelines for managing risks in recreational waters (10 x drinking water guideline value, Table 9.3)
|
Metal in Water |
NHMRC (2008)2 |
Samples from the Great Darling Anabranch region (total acid-extractable metals) |
|||
|---|---|---|---|---|---|
|
Recreational Water Guidelines |
9 |
10 |
11 |
12 |
|
|
(mg/L) |
(mg/L) |
(mg/L) |
(mg/L) |
(mg/L) |
|
|
Aluminium |
No value |
2.7 |
4.2 |
3.2 |
6.1 |
|
Arsenic |
0.07 |
0.006 |
0.006 |
0.007 |
0.005 |
|
Chromium |
0.5 |
0.002 |
0.003 |
0.002 |
0.006 |
|
Cobalt |
No value |
0.0005 |
0.0013 |
0.0007 |
0.0017 |
|
Copper |
20 |
0.0036 |
0.0044 |
0.0038 |
0.0052 |
|
Lead |
0.1 |
0.0003 |
0.0007 |
0.0004 |
0.0014 |
|
Nickel |
0.2 |
0.0035 |
0.0049 |
0.0037 |
0.0064 |
|
Zinc |
30 |
0.006 |
0.007 |
0.004 |
0.0010 |
2NHMRC (2008) Guidelines for managing risks in recreational waters (10 x drinking water guideline value, Table 9.3)
|
Metal in Water |
NHMRC (2008)2 |
Samples from the lower Darling-Barka River between Weir 32 and Pooncarie (total acid-extractable metals) |
|||||||
|---|---|---|---|---|---|---|---|---|---|
|
Recreational Water Guidelines |
13 |
14 |
15 |
16 |
17 |
18 |
19 |
20 |
|
|
(mg/L) |
(mg/L) |
(mg/L) |
(mg/L) |
(mg/L) |
(mg/L) |
(mg/L) |
(mg/L) |
(mg/L) |
|
|
Aluminium |
No value |
5.3 |
5.6 |
5.7 |
5.2 |
5.5 |
5.5 |
4.7 |
4.8 |
|
Arsenic |
0.07 |
0.005 |
0.005 |
0.005 |
0.005 |
0.005 |
0.005 |
0.005 |
0.005 |
|
Chromium |
0.5 |
0.004 |
0.005 |
0.005 |
0.005 |
0.005 |
0.005 |
0.004 |
0.004 |
|
Cobalt |
No value |
0.0016 |
0.0018 |
0.0024 |
0.0020 |
0.0021 |
0.0023 |
0.0020 |
0.0019 |
|
Copper |
20 |
0.0046 |
0.0048 |
0.0049 |
0.0045 |
0.0046 |
0.0049 |
0.0042 |
0.0042 |
|
Lead |
0.1 |
0.0011 |
0.0012 |
0.0014 |
0.0012 |
0.0012 |
0.0013 |
0.0012 |
0.0012 |
|
Nickel |
0.2 |
0.0058 |
0.0063 |
0.0087 |
0.0064 |
0.0064 |
0.0066 |
0.0062 |
0.0063 |
|
Zinc |
30 |
0.011 |
0.010 |
0.010 |
0.008 |
0.008 |
0.009 |
0.007 |
0.008 |
2NHMRC (2008) Guidelines for managing risks in recreational waters (10 x drinking water guideline value, Table 9.3)
|
Metal in Water |
ANZG 20183 |
Samples from the Menindee Weir Pools along the Darling-Barka River (dissolved metals) |
|||||||
|---|---|---|---|---|---|---|---|---|---|
|
Water Quality Guideline for aquatic ecosystems (95% species protection) |
1 |
2 |
3 |
4 |
5 |
6 |
7 |
8 |
|
|
(mg/L) |
(mg/L) |
(mg/L) |
(mg/L) |
(mg/L) |
(mg/L) |
(mg/L) |
(mg/L) |
(mg/L) |
|
|
Aluminium |
0.055 |
<0.04 |
<0.04 |
<0.04 |
<0.04 |
<0.04 |
<0.04 |
<0.04 |
<0.04 |
|
Arsenic |
0.013 |
0.002 |
0.003 |
0.004 |
0.004 |
0.003 |
0.003 |
0.004 |
0.006 |
|
Cadmium |
0.0002 |
<0.0001 |
<0.0001 |
<0.0001 |
<0.0001 |
<0.0001 |
<0.0001 |
<0.0001 |
<0.0001 |
|
Chromium |
0.001 |
<0.001 |
<0.001 |
<0.001 |
<0.001 |
<0.001 |
<0.001 |
<0.001 |
<0.001 |
|
Cobalt |
No value |
0.0002 |
0.0002 |
0.0002 |
0.0002 |
0.0002 |
0.0002 |
0.0001 |
<0.0001 |
|
Copper |
0.0014 |
0.0010 |
0.0023 |
0.0022 |
0.0020 |
0.0019 |
0.0018 |
0.0022 |
0.0027 |
|
Lead |
0.0034 |
<0.0001 |
<0.0001 |
<0.0001 |
<0.0001 |
<0.0001 |
<0.0001 |
<0.0001 |
<0.0001 |
|
Manganese |
1.9 |
<0.001 |
<0.001 |
<0.001 |
<0.001 |
<0.001 |
<0.001 |
<0.001 |
<0.001 |
|
Nickel |
0.011 |
0.0025 |
0.0033 |
0.0033 |
0.0032 |
0.0032 |
0.0032 |
0.0028 |
0.0023 |
|
Selenium |
0.005 |
<0.005 |
<0.005 |
<0.005 |
<0.005 |
<0.005 |
<0.005 |
<0.005 |
<0.005 |
|
Silver |
0.0005 |
<0.0001 |
<0.0001 |
<0.0001 |
<0.0001 |
<0.0001 |
<0.0001 |
<0.0001 |
<0.0001 |
|
Zinc |
0.008 |
<0.001 |
<0.001 |
<0.001 |
<0.001 |
<0.001 |
<0.001 |
<0.001 |
0.001 |
3ANZG (2018). Australian and New Zealand Guidelines for Fresh and Marine Water Quality. Australian and New Zealand Governments and Australian state and territory governments, Canberra ACT, Australia.
|
Metal in Water
|
ANZG 20183 |
Samples from the Great Darling Anabranch region (dissolved metals) |
|||
|---|---|---|---|---|---|
|
Water Quality Guideline for aquatic ecosystems (95% species protection) |
9 |
10 |
11 |
12 |
|
|
(mg/L) |
(mg/L) |
(mg/L) |
(mg/L) |
(mg/L) |
|
|
Aluminium |
0.055 |
<0.04 |
<0.04 |
<0.04 |
<0.04 |
|
Arsenic |
0.013 |
0.006 |
0.005 |
0.006 |
0.005 |
|
Cadmium |
0.0002 |
<0.0001 |
<0.0001 |
<0.0001 |
<0.0001 |
|
Chromium |
0.001 |
<0.001 |
<0.001 |
<0.001 |
<0.001 |
|
Cobalt |
No value |
<0.0001 |
0.0002 |
<0.0001 |
0.0001 |
|
Copper |
0.0014 |
0.0024 |
0.0020 |
0.0023 |
0.0019 |
|
Lead |
0.0034 |
<0.0001 |
<0.0001 |
<0.0001 |
<0.0001 |
|
Manganese |
1.9 |
<0.001 |
<0.001 |
<0.001 |
<0.001 |
|
Nickel |
0.011 |
0.0022 |
0.0023 |
0.0022 |
0.0022 |
|
Selenium |
0.005 |
<0.005 |
<0.005 |
<0.005 |
<0.005 |
|
Silver |
0.0005 |
<0.0001 |
<0.0001 |
<0.0001 |
<0.0001 |
|
Zinc |
0.008 |
<0.001 |
<0.001 |
<0.001 |
<0.001 |
3ANZG (2018). Australian and New Zealand Guidelines for Fresh and Marine Water Quality. Australian and New Zealand Governments and Australian state and territory governments, Canberra ACT, Australia.
|
Metal in Water
|
ANZG 20183 |
Samples from the lower Darling-Barka River between Weir 32 and Pooncarie (dissolved metals) |
|||||||
|---|---|---|---|---|---|---|---|---|---|
|
Water Quality Guideline for aquatic ecosystems (95% species protection) |
13 |
14 |
15 |
16 |
17 |
18 |
19 |
20 |
|
|
(mg/L) |
(mg/L) |
(mg/L) |
(mg/L) |
(mg/L) |
(mg/L) |
(mg/L) |
(mg/L) |
(mg/L) |
|
|
Aluminium |
0.055 |
<0.04 |
<0.04 |
<0.04 |
<0.04 |
<0.04 |
<0.04 |
<0.04 |
<0.04 |
|
Arsenic |
0.013 |
0.004 |
0.004 |
0.004 |
0.004 |
0.005 |
0.004 |
0.004 |
0.004 |
|
Cadmium |
0.0002 |
<0.0001 |
<0.0001 |
<0.0001 |
<0.0001 |
<0.0001 |
<0.0001 |
<0.0001 |
<0.0001 |
|
Chromium |
0.001 |
<0.001 |
<0.001 |
<0.001 |
<0.001 |
<0.001 |
<0.001 |
<0.001 |
<0.001 |
|
Cobalt |
No value |
0.0002 |
0.0002 |
0.0003 |
0.0003 |
0.0003 |
0.0002 |
0.0002 |
0.0002 |
|
Copper |
0.0014 |
0.0022 |
0.0023 |
0.0021 |
0.0020 |
0.0019 |
0.0019 |
0.0016 |
0.0017 |
|
Lead |
0.0034 |
<0.0001 |
<0.0001 |
<0.0001 |
<0.0001 |
<0.0001 |
<0.0001 |
<0.0001 |
<0.0001 |
|
Manganese |
1.9 |
<0.001 |
<0.001 |
<0.001 |
<0.001 |
<0.001 |
<0.001 |
<0.001 |
<0.001 |
|
Nickel |
0.011 |
0.0028 |
0.0029 |
0.0031 |
0.0032 |
0.0032 |
0.0033 |
0.0030 |
0.0031 |
|
Selenium |
0.005 |
<0.005 |
<0.005 |
<0.005 |
<0.005 |
<0.005 |
<0.005 |
<0.005 |
<0.005 |
|
Silver |
0.0005 |
<0.0001 |
<0.0001 |
<0.0001 |
<0.0001 |
<0.0001 |
<0.0001 |
<0.0001 |
<0.0001 |
|
Zinc |
0.008 |
<0.001 |
0.001 |
<0.001 |
<0.001 |
<0.001 |
<0.001 |
<0.001 |
<0.001 |
3ANZG (2018). Australian and New Zealand Guidelines for Fresh and Marine Water Quality. Australian and New Zealand Governments and Australian state and territory governments, Canberra ACT, Australia.
References
ANZG (2018), Australian and New Zealand Guidelines for Fresh and Marine Water Quality, Australian and New Zealand Governments and Australian state and territory governments, Canberra ACT, Australia. Available at www.waterquality.gov.au/anz-guidelines
Basin Plan (2012), Schedule 11, Water Act 2007, Murray-Darling Basin Authority, Commonwealth of Australia
NHMRC (2008), Guidelines for managing risks in recreational waters, Australian Government National Health and Medical Research Council
Download the full test results
16 May results
- Report for metals and pesticides – 16 May, Menindee weir pools (PDF ccKB)s
- Report for algal toxins – 16 May, Menindee weir pools (PDF 187KB)
- Report for algal identification and cell count – 16 May, Menindee weir pools (PDF 224KB)
- Report for glyphosate and phenoxyherbicides – 16 May, Menindee (PDF 697KB)
- Report for nutrients – 16 May, Menindee (PDF 710KB)
17 May results
- Report for metals and pesticides – 17 May, Great Darling Anabranch and Lower Darling-Barka River (PDF 168KB)
- Report for algal toxins – 17 May, Great Darling Anabranch and Lower Darling-Barka River (PDF 186KB)
- Report for algal identification and cell count – 17 May, Great Darling Anabranch and Lower Darling-Barka River (PDF 217KB)
- Report for nutrients, glyphosate and phenoxyherbicides – 17 May, Great Darling Anabranch and Lower Darling-Barka River (PDF 711KB)
18 May results
- Report for metals and pesticides – 18 May, Lower Darling-Barka River (PDF 162KB)
- Report for algal toxins – 18 May, Lower Darling-Barka River (PDF 176KB)
- Report for algal identification and cell count – 18 May, Lower Darling-Barka River (PDF 215KB)
- Report for nutrients, glyphosate and phenoxyherbicides – 18 May, Lower Darling-Barka River (PDF 703KB)
The Department of Planning and Environment (DPE) and the NSW Environment Protection Authority (EPA) collected fifteen water samples between 12 and 13 May 2023 at Menindee along the Darling-Barka River, downstream along the lower Darling-Barka River, and along the Great Darling Anabranch.
Samples were checked for pesticides, excess nitrogen and phosphorus, ammonia, metals, algae and algal toxins.
Summary
Pesticides
Samples were scanned for more than 600 pesticides. None were detected.
Nitrogen and phosphorus
Nitrogen and phosphorous levels are high. If nitrogen and phosphorus stay high they can cause algal blooms.
Algae and algal toxins
Blue-green algae were detected in all samples, but potentially toxic blue-green algae were detected in five of the fifteen samples. The algal toxin Cylindrospermopsin was detected in five samples across all regions.
A ‘red alert’ is in place along parts of the lower Darling-Barka River. An ‘amber alert’ is in place along the Great Darling Anabranch and along the Darling-Barka River, at Menindee and further downstream, as of 3 July 2023. See WaterNSW for information about red alerts
Metals
Copper is slightly above the level set to protect water life in fourteen samples across all regions, but well below the level harmful to fish. All other metals were under the levels set to protect water life.
Sample locations
Water was sampled between 12 and 13 May 2023 from fifteen locations on the Darling-Barka River at Menindee, downstream along the lower Darling-Barka River, and along the Great Darling Anabranch.
On the 12 May 2023, eight samples were collected from the Menindee Weir Pools in the Darling-Barka River. The correlating sample identifications are given in brackets for reference to the full laboratory report data.
- Sample 1 (B1) – Lake Wetherell upstream of the Main Weir
- Sample 2 (B2) – Outlet of Lake Pamamaroo into Darling River
- Sample 3 (E1) – Upper weir pool
- Sample 4 (E2) – Mid weir pool
- Sample 5 (E3) – Menindee town
- Sample 6 (E4) – Downstream Menindee town
- Sample 7 (E5) – Lower weir pool downstream Lake Menindee inflow
- Sample 8 (B3) – Outlet of Lake Menindee into Darling-Barka River
On the 13 May 2023, four samples were collected from the Great Darling Anabranch region and three samples from the Lower Darling-Barka River between Weir 32 and Pooncarie.
- Sample 9 (B4) – Lake Cawndilla outlet into the anabranch of Darling River
- Sample 10 (E6) – Redbank Creek upstream of Cawndilla Channel confluence
- Sample 11 (E6.5) – Tandou Creek at Tandou Woolshed Rd (incorporating inflows from Kangaroo Lake)
- Sample 12 (E7) – Tandou Creek at Packers Crossing (incorporating inflows from Packers Lake)
- Sample 13 (E8) – Kinchega National Park upper
- Sample 14 (E9) – Kinchega National Park mid (incorporating inflows from Emu Lake)
- Sample 15 (E10) – Kinchega National Park lower (upstream of Anabranch offtake)
Figure 1: Sample locations where samples were taken between 12 and 13 May 2023.
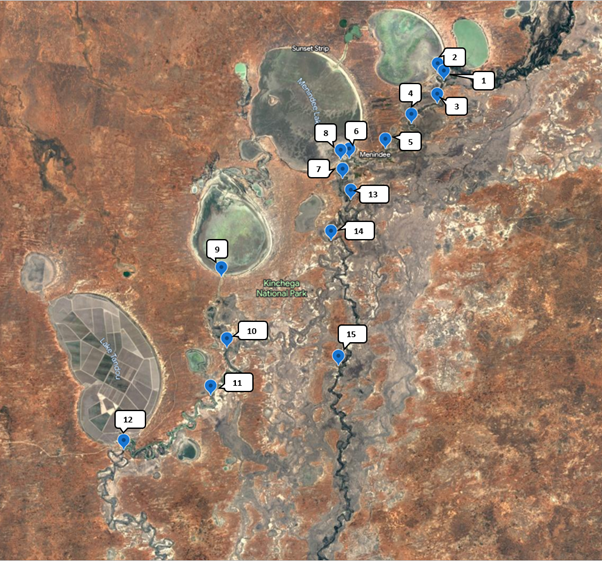
More sampling
The DPE and EPA are conducting regular water quality monitoring on the Darling-Barka River from upstream of Menindee to Pooncarie as well as the Great Darling Anabranch. The test results from these samples will also be published on this website.
In-field measurements
At the time of sampling, the EPA collected in-field measurements for pH, dissolved oxygen, conductivity, temperature and turbidity.
pH was outside the guideline value for all samples in the Great Darling Anabranch region.
All other parameters were within the expected ranges.
|
Sample |
Location |
Temp (°C) |
Dissolved oxygen (mg/L) |
Electrical conductivity (µS/cm) |
pH |
Turbidity (NTU) |
|---|---|---|---|---|---|---|
|
1 (B1) |
Lake Wetherell upstream of the Main Weir |
15.4 |
9.9 |
540 |
8.5 |
8.7 |
|
2 (B2) |
Outlet of Lake Pamamaroo into Darling River |
14.1 |
8.4 |
396 |
8.4 |
42.8 |
|
3 (E1) |
Upper weir pool |
14.7 |
9.1 |
398 |
8.5 |
48.6 |
|
4 (E2) |
Mid weir pool |
15.3 |
7.9 |
426 |
8.3 |
33.1 |
|
5 (E3) |
Menindee town |
16.1 |
7.7 |
445 |
8.3 |
29.6 |
|
6 (E4) |
Downstream Menindee town |
16.2 |
5.8 |
446 |
8.1 |
33.9 |
|
7 (E5) |
Lower weir pool downstream Lake Menindee inflow |
15.0 |
7.2 |
385 |
8.2 |
48.0 |
|
8 (B3) |
Outlet of Lake Menindee into Darling-Barka River |
14.3 |
10.0 |
335 |
8.6 |
54.6 |
|
9 (B4) |
Lake Cawndilla outlet into the anabranch of Darling River |
15.5 |
9.8 |
374 |
8.6 |
20.9 |
|
10 (E6) |
Redbank Creek upstream of Cawndilla Channel confluence |
16.3 |
6.5 |
388 |
8.6 |
29.5 |
|
11 (E6.5) |
Tandou Creek at Tandou Woolshed Rd (incorporating inflows from Kangaroo Lake) |
16.7 |
11.3 |
381 |
8.7 |
25.8 |
|
12 (E7) |
Tandou Creek at Packers Crossing (incorporating inflows from Packers Lake) |
16.1 |
10.1 |
393 |
8.9 |
34.5 |
|
13 (E8) |
Kinchega National Park upper |
14.4 |
8.2 |
382 |
8.2 |
47.8 |
|
14 (E9) |
Kinchega National Park mid (incorporating inflows from Emu Lake) |
14.1 |
8.0 |
379 |
8.1 |
54.0 |
|
15 (E10) |
Kinchega National Park lower (upstream of anabranch offtake) |
14.5 |
7.9 |
391 |
8.1 |
49.7 |
Nitrogen, phosphorus and ammonia
Sample results show that total nitrogen and total phosphorous are higher than the acceptable levels given for lowland river ecosystems in NSW (ANZG 2018, which are in agreement with the regionally specific set of guideline values for the Murray-Darling outlined in the Basin Plan 2012). Total nitrogen was detected at three times higher than the guideline value, while total phosphorous was detected at six times higher. Algal blooms are possible if these nutrients remain elevated.
Bacteria convert nitrogen compounds such as ammonia into nitrite and nitrate. These compounds can harm aquatic organisms. Ammonia was well below the Australian and New Zealand water quality guidelines for toxicity. While the levels would not be expected to be harmful to fish, the ammonia could promote growth in algae and macrophytes. The ammonia is likely to be from river sources including rotting fish and flood organic matter rather than diffuse inputs from surrounding land.
Algae and algal toxins
There were positive detections in all samples for blue-green algae. However, only the blue-green algae detections found in samples 1, 10, 12 and 14 and 15 were considered potentially toxic. The algal toxin Cylindrospermopsin was also detected in these five samples.
The algae levels detected fall within the ‘amber’ to ‘red’ alert levels. A ‘red alert’ is in place along parts of the lower Darling-Barka River. An ‘amber alert’ is in place along the Great Darling Anabranch and along the Darling-Barka River, at Menindee and further downstream, as of 3 July 2023.
Pesticides
As noted above, a pesticide screening test that scanned for over 600 pesticides was completed for samples from all three regions. All samples came back negative for pesticide detection.
Metals
Many metals are vital for humans and animals to stay healthy and only pose a risk if they are found at high levels in the environment. Concentrations of key metals found in water are below.
Total metals have been compared to recreational water quality guidelines and dissolved metals have been compared to ecological water quality guidelines as per the National Health and Medical Research Council (NHMRC) recreational and Australian and New Zealand Water Quality (ANZG) guidelines, respectively.
Total metals provide a more conservative estimate of exposure from recreational use whereas dissolved metals are used for ecological assessments as this is the bioavailable fraction of the metal (the part that is toxic to organisms).
|
Metal in Water |
NHMRC (2008)2 |
Samples from the Menindee Weir Pools in the Darling-Barka River (total acid-extractable metals) |
|||||||
|---|---|---|---|---|---|---|---|---|---|
|
Recreational Water Guidelines |
1 |
2 |
3 |
4 |
5 |
6 |
7 |
8 |
|
|
(mg/L) |
(mg/L) |
(mg/L) |
(mg/L) |
(mg/L) |
(mg/L) |
(mg/L) |
(mg/L) |
(mg/L) |
|
|
Aluminium |
No value |
0.57 |
4.6 |
5.3 |
3.8 |
2.9 |
4.1 |
6.1 |
6.2 |
|
Arsenic |
0.07 |
0.002 |
0.004 |
0.004 |
0.004 |
0.003 |
0.003 |
0.005 |
0.006 |
|
Chromium |
0.5 |
<0.001 |
0.004 |
0.005 |
0.003 |
0.003 |
0.004 |
0.005 |
0.005 |
|
Cobalt |
No value |
0.0009 |
0.0016 |
0.0018 |
0.0016 |
0.0014 |
0.0016 |
0.0017 |
0.0012 |
|
Copper |
20 |
0.0019 |
0.0047 |
0.0048 |
0.0042 |
0.0031 |
0.0038 |
0.0047 |
0.0056 |
|
Lead |
0.1 |
0.0005 |
0.0009 |
0.0010 |
0.0009 |
0.0008 |
0.0012 |
0.0012 |
0.0010 |
|
Nickel |
0.2 |
0.0036 |
0.0060 |
0.0064 |
0.0057 |
0.0049 |
0.0058 |
0.0061 |
0.0054 |
|
Zinc |
30 |
0.003 |
0.007 |
0.008 |
0.006 |
0.004 |
0.006 |
0.008 |
0.008 |
2NHMRC (2008) Guidelines for managing risks in recreational waters (10 x drinking water guideline value, Table 9.3)
|
Metal in Water |
NHMRC (2008)2 |
Samples from the Great Darling Anabranch region (total acid-extractable metals) |
|||
|---|---|---|---|---|---|
|
Recreational Water Guidelines |
9 |
10 |
11 |
12 |
|
|
(mg/L) |
(mg/L) |
(mg/L) |
(mg/L) |
(mg/L) |
|
|
Aluminium |
No value |
2.7 |
3.4 |
3.0 |
5.0 |
|
Arsenic |
0.07 |
0.006 |
0.006 |
0.006 |
0.007 |
|
Chromium |
0.5 |
0.002 |
0.003 |
0.003 |
0.004 |
|
Cobalt |
No value |
0.0005 |
0.0009 |
0.0007 |
0.0014 |
|
Copper |
20 |
0.0036 |
0.0041 |
0.0043 |
0.0046 |
|
Lead |
0.1 |
0.0004 |
0.0006 |
0.0005 |
0.0011 |
|
Nickel |
0.2 |
0.0035 |
0.0041 |
0.0039 |
0.0051 |
|
Zinc |
30 |
0.004 |
0.006 |
0.005 |
0.009 |
2NHMRC (2008) Guidelines for managing risks in recreational waters (10 x drinking water guideline value, Table 9.3)
|
Metal in Water |
NHMRC (2008)2 |
Samples from the Lower Darling-Barka River between Weir 32 and Pooncarie (total acid-extractable metals) |
||
|---|---|---|---|---|
|
Recreational Water Guidelines |
13 |
14 |
15 |
|
|
(mg/L) |
(mg/L) |
(mg/L) |
(mg/L) |
|
|
Aluminium |
No value |
6.4 |
6.3 |
6.5 |
|
Arsenic |
0.07 |
0.005 |
0.005 |
0.005 |
|
Chromium |
0.5 |
0.006 |
0.007 |
0.006 |
|
Cobalt |
No value |
0.0018 |
0.0020 |
0.0024 |
|
Copper |
20 |
0.0054 |
0.0052 |
0.0052 |
|
Lead |
0.1 |
0.0012 |
0.0014 |
0.0015 |
|
Nickel |
0.2 |
0.0067 |
0.0069 |
0.0070 |
|
Zinc |
30 |
0.0010 |
0.009 |
0.0010 |
2NHMRC (2008) Guidelines for managing risks in recreational waters (10 x drinking water guideline value, Table 9.3)
|
Metal in Water
|
ANZG 20183 |
Samples from the Menindee Weir Pools in the Darling-Barka River |
|||||||
|---|---|---|---|---|---|---|---|---|---|
|
Water Quality Guideline for aquatic ecosystems (95% species protection) |
1 |
2 |
3 |
4 |
5 |
6 |
7 |
8 |
|
|
(mg/L) |
(mg/L) |
(mg/L) |
(mg/L) |
(mg/L) |
(mg/L) |
(mg/L) |
(mg/L) |
(mg/L) |
|
|
Aluminium |
0.055 |
<0.04 |
<0.04 |
<0.04 |
<0.04 |
<0.04 |
<0.04 |
<0.04 |
<0.04 |
|
Arsenic |
0.013 |
0.002 |
0.004 |
0.004 |
0.003 |
0.003 |
0.003 |
0.004 |
0.006 |
|
Cadmium |
0.0002 |
<0.0001 |
<0.0001 |
<0.0001 |
<0.0001 |
<0.0001 |
<0.0001 |
<0.0001 |
<0.0001 |
|
Chromium |
0.001 |
<0.001 |
<0.001 |
<0.001 |
<0.001 |
<0.001 |
<0.001 |
<0.001 |
<0.001 |
|
Cobalt |
No value |
0.0002 |
0.0002 |
0.0002 |
0.0002 |
0.0002 |
0.0002 |
0.0002 |
0.0001 |
|
Copper |
0.0014 |
0.0011 |
0.0023 |
0.0024 |
0.0022 |
0.0018 |
0.0017 |
0.0022 |
0.0029 |
|
Lead |
0.0034 |
<0.0001 |
<0.0001 |
<0.0001 |
<0.0001 |
<0.0001 |
<0.0001 |
<0.0001 |
<0.0001 |
|
Manganese |
1.9 |
<0.001 |
<0.001 |
<0.001 |
<0.001 |
<0.001 |
<0.001 |
<0.001 |
<0.001 |
|
Nickel |
0.011 |
0.0027 |
0.0033 |
0.0033 |
0.0033 |
0.0032 |
0.0032 |
0.0027 |
0.0022 |
|
Selenium |
0.005 |
<0.005 |
<0.005 |
<0.005 |
<0.005 |
<0.005 |
<0.005 |
<0.005 |
<0.005 |
|
Silver |
0.0005 |
<0.0001 |
<0.0001 |
<0.0001 |
<0.0001 |
<0.0001 |
<0.0001 |
<0.0001 |
<0.0001 |
|
Zinc |
0.008 |
<0.001 |
0.002 |
<0.001 |
<0.001 |
<0.001 |
<0.001 |
<0.001 |
0.001 |
3ANZG (2018). Australian and New Zealand Guidelines for Fresh and Marine Water Quality. Australian and New Zealand Governments and Australian state and territory governments, Canberra ACT, Australia.
|
Metal in Water
|
ANZG 20183 |
Samples from the Great Darling Anabranch region |
|||
|---|---|---|---|---|---|
|
Water Quality Guideline for aquatic ecosystems (95% species protection) |
9 |
10 |
11 |
12 |
|
|
(mg/L) |
(mg/L) |
(mg/L) |
(mg/L) |
(mg/L) |
|
|
Aluminium |
0.055 |
<0.04 |
<0.04 |
<0.04 |
<0.04 |
|
Arsenic |
0.013 |
0.006 |
0.006 |
0.006 |
0.007 |
|
Cadmium |
0.0002 |
<0.0001 |
<0.0001 |
<0.0001 |
<0.0001 |
|
Chromium |
0.001 |
<0.001 |
<0.001 |
<0.001 |
<0.001 |
|
Cobalt |
No value |
<0.0001 |
0.0002 |
0.0001 |
0.0002 |
|
Copper |
0.0014 |
0.0025 |
0.0022 |
0.0024 |
0.0020 |
|
Lead |
0.0034 |
<0.0001 |
<0.0001 |
<0.0001 |
<0.0001 |
|
Manganese |
1.9 |
<0.001 |
<0.001 |
<0.001 |
<0.001 |
|
Nickel |
0.011 |
0.0021 |
0.0023 |
0.0023 |
0.0021 |
|
Selenium |
0.005 |
<0.005 |
<0.005 |
<0.005 |
<0.005 |
|
Silver |
0.0005 |
<0.0001 |
<0.0001 |
<0.0001 |
<0.0001 |
|
Zinc |
0.008 |
0.002 |
0.002 |
0.002 |
0.001 |
3ANZG (2018). Australian and New Zealand Guidelines for Fresh and Marine Water Quality. Australian and New Zealand Governments and Australian state and territory governments, Canberra ACT, Australia.
|
Metal in Water
|
ANZG 20183 |
Samples from the Lower Darling-Barka River between Weir 32 and Pooncarie |
||
|---|---|---|---|---|
|
Water Quality Guideline for aquatic ecosystems (95% species protection) |
13 |
14 |
15 |
|
|
(mg/L) |
(mg/L) |
(mg/L) |
(mg/L) |
|
|
Aluminium |
0.055 |
<0.04 |
<0.04 |
<0.04 |
|
Arsenic |
0.013 |
0.004 |
0.005 |
0.005 |
|
Cadmium |
0.0002 |
<0.0001 |
<0.0001 |
<0.0001 |
|
Chromium |
0.001 |
<0.001 |
<0.001 |
<0.001 |
|
Cobalt |
No value |
0.0002 |
0.0002 |
0.0003 |
|
Copper |
0.0014 |
0.0022 |
0.0023 |
0.0021 |
|
Lead |
0.0034 |
<0.0001 |
<0.0001 |
<0.0001 |
|
Manganese |
1.9 |
<0.001 |
<0.001 |
<0.001 |
|
Nickel |
0.011 |
0.0028 |
0.0029 |
0.0031 |
|
Selenium |
0.005 |
<0.005 |
<0.005 |
<0.005 |
|
Silver |
0.0005 |
<0.0001 |
<0.0001 |
<0.0001 |
|
Zinc |
0.008 |
<0.001 |
<0.001 |
<0.001 |
3ANZG (2018). Australian and New Zealand Guidelines for Fresh and Marine Water Quality. Australian and New Zealand Governments and Australian state and territory governments, Canberra ACT, Australia.
References
ANZG (2018), Australian and New Zealand Guidelines for Fresh and Marine Water Quality, Australian and New Zealand Governments and Australian state and territory governments, Canberra ACT, Australia. Available at www.waterquality.gov.au/anz-guidelines
Basin Plan (2012), Schedule 11, Water Act 2007, Murray-Darling Basin Authority, Commonwealth of Australia
NHMRC (2008), Guidelines for managing risks in recreational waters, Australian Government National Health and Medical Research Council
Download the full test results
12 May results
- Report for metals and pesticides – 12 May, Menindee weir pools (PDF 1MB)
- Report for algal toxins – 12 May, Menindee weir pools (PDF 161KB)
- Report for algal identification and cell count – 12 May, Menindee weir pools (PDF 202KB)
- Report for nutrients, glyphosate and phenoxyherbicides – 12 Menindee weir pools (PDF 692KB)
13 May results
- Report for metals and pesticides – 13 May, Great Darling Anabranch and Lower Darling-Barka River (PDF 1MB)
- Report for algal toxins –13 May, Great Darling Anabranch and Lower Darling-Barka River (PDF 161KB)
- Report for algal identification and cell count – 13 May, Great Darling Anabranch and Lower Darling-Barka River (PDF 202KB)
- Report for nutrients, glyphosate and phenoxyherbicides – 13 May, Great Darling Anabranch and Lower Darling-Barka River (PDF 692KB)
The Department of Planning and Environment (DPE) and the NSW Environment Protection Authority (EPA) collected twenty water samples between 9 and 11 May 2023 at Menindee along the Darling-Barka River, downstream along the lower Darling-Barka River, and along the Great Darling Anabranch.
Samples were checked for pesticides, excess nitrogen and phosphorus, ammonia, metals, algae and algal toxins.
Summary
Pesticides
Samples were scanned for more than 600 pesticides. None were detected.
Nitrogen and phosphorus
Nitrogen and phosphorous levels are high. If nitrogen and phosphorus stay high they can cause algal blooms.
Algae and algal toxins
Potentially toxic blue-green algae were detected in nine of the samples. All samples had detections of blue-green algae that are not considered potentially toxic. The algal toxin Cylindrospermopsin was detected in eleven samples.
A ‘red alert’ is in place along parts of the lower Darling-Barka River. An ‘amber alert’ is in place along the Great Darling Anabranch and along the Darling-Barka River, at Menindee and further downstream, as of 29 June 2023. See WaterNSW for information about red alerts
Metals
Copper was slightly above the level set to protect water life in most samples across all 3 regions, but well below the level harmful to fish. All other metals were under the levels set to protect water life.
Sample locations
Water was sampled between 9 and 11 May 2023 from twenty locations on the Darling-Barka River at Menindee, downstream along the lower Darling-Barka River, and along the Great Darling Anabranch.
On 9 May 2023, eight samples were collected from the Menindee Weir Pools in the Darling-Barka River. The correlating sample identifications are given in brackets for reference to the full laboratory report data.
- Sample 1 (B1) – Lake Wetherell upstream of the Main Weir
- Sample 2 (B2) – Outlet of Lake Pamamaroo into Darling River
- Sample 3 (E1) – Upper weir pool
- Sample 4 (E2) – Mid weir pool
- Sample 5 (E3) – Menindee town
- Sample 6 (E4) – Downstream Menindee town
- Sample 7 (E5) – Lower weir pool downstream Lake Menindee inflow
- Sample 8 (B3) – Outlet of Lake Menindee into Darling-Barka River
On 10 May 2023, four samples were collected from the Great Darling Anabranch region and three samples from the Lower Darling-Barka River between Weir 32 and Pooncarie.
- Sample 9 (B4) – Lake Cawndilla outlet into the anabranch of Darling River
- Sample 10 (E6) – Redbank Creek upstream of Cawndilla Channel confluence
- Sample 11 (E6.5) – Tandou Creek at Tandou Woolshed Rd (incorporating inflows from Kangaroo Lake)
- Sample 12 (E7) – Tandou Creek at Packers Crossing (incorporating inflows from Packers Lake)
- Sample 13 (E8) – Kinchega National Park upper
- Sample 14 (E9) – Kinchega National Park mid (incorporating inflows from Emu Lake)
- Sample 15 (E10) – Kinchega National Park lower (upstream of Anabranch offtake)
On 11 May 2023, five samples were collected from the Lower Darling-Barka River between Weir 32 and Pooncarie.
- Sample 16 (E11) – Bindara Station reach
- Sample 17 (E12) – Karoola Station reach
- Sample 18 (E13) – Coona Point reach
- Sample 19 (E14) – Mullingar Station reach
- Sample 20 (E15) – Old wharf at Pooncarie
Figure 1: Sample locations where samples were taken between 9 to 11 May 2023. See Figures 2 and 3 below for more detail.

Figure 2: Sample locations for the Menindee Weir Pools region along the Darling-Barka River

Figure 3: Sample locations for the Great Darling Anabranch and lower Darling-Barka river between Weir 32 and Pooncarie regions

More sampling
The DPE and EPA are conducting regular water quality monitoring on the Darling-Barka River from upstream of Menindee to Pooncarie as well as the Great Darling Anabranch. The test results from these samples will also be published on this website.
In-field measurements
At the time of sampling, the EPA collected in-field measurements for pH, dissolved oxygen, conductivity, temperature and turbidity.
pH was outside the guideline value for all samples in the Great Darling Anabranch region.
All other parameters were within the expected ranges.
|
Sample |
Location |
Temp (°C) |
Dissolved oxygen (mg/L) |
Electrical conductivity (µS/cm) |
pH |
Turbidity (NTU) |
|---|---|---|---|---|---|---|
|
1 (B1) |
Lake Wetherell upstream of the Main Weir |
14.2 |
7.1 |
528 |
8.3 |
15.7 |
|
2 (B2) |
Outlet of Lake Pamamaroo into Darling River |
14.5 |
8.2 |
516 |
8.1 |
34.1 |
|
3 (E1) |
Upper weir pool |
14.2 |
8.4 |
426 |
8.3 |
33.6 |
|
4 (E2) |
Mid weir pool |
15.2 |
6.5 |
436 |
8.2 |
37.3 |
|
5 (E3) |
Menindee town |
15.5 |
5.4 |
428 |
8.1 |
44.7 |
|
6 (E4) |
Downstream Menindee town |
16.1 |
5.1 |
440 |
8.0 |
40.8 |
|
7 (E5) |
Lower weir pool downstream Lake Menindee inflow |
14.7 |
6.7 |
383 |
8.1 |
55.8 |
|
8 (B3) |
Outlet of Lake Menindee into Darling-Barka River |
12.9 |
10.1 |
321 |
8.6 |
71.8 |
|
9 (B4) |
Lake Cawndilla outlet into the anabranch of Darling River |
15.5 |
9.9 |
366 |
8.6 |
27.2 |
|
10 (E6) |
Redbank Creek upstream of Cawndilla Channel confluence |
14.8 |
6.9 |
378 |
8.6 |
37.7 |
|
11 (E6.5) |
Tandou Creek at Tandou Woolshed Rd (incorporating inflows from Kangaroo Lake) |
15.6 |
10.7 |
372 |
8.7 |
24.9 |
|
12 (E7) |
Tandou Creek at Packers Crossing (incorporating inflows from Packers Lake) |
15.4 |
9.4 |
390 |
8.8 |
40.1 |
|
13 (E8) |
Kinchega National Park upper |
14.3 |
7.9 |
380 |
8.1 |
51.7 |
|
14 (E9) |
Kinchega National Park mid (incorporating inflows from Emu Lake) |
14.0 |
7.9 |
380 |
8.1 |
52.3 |
|
15 (E10) |
Kinchega National Park lower (upstream of Anabranch offtake) |
14.4 |
7.7 |
410 |
8.1 |
47.7 |
|
16 (E11) |
Bindara Station reach |
14.9 |
8.1 |
416 |
8.1 |
43.5 |
|
17 (E12) |
Karoola Station reach |
14.2 |
7.4 |
403 |
8.0 |
48.9 |
|
18 (E13) |
Coona Point reach |
14.7 |
8.3 |
422 |
8.0 |
49.3 |
|
19 (E14) |
Mullingar Station reach |
14.5 |
8.8 |
408 |
8.0 |
47.9 |
|
20 (E15) |
Old wharf at Pooncarie |
14.2 |
8.0 |
405 |
8.0 |
48.4 |
Nitrogen, phosphorus and ammonia
Sample results show that total nitrogen and total phosphorous are higher than the acceptable levels given for lowland river ecosystems in NSW (ANZG 2018, which are in agreement with the regionally specific set of guideline values for the Murray-Darling outlined in the Basin Plan 2012). Total nitrogen was detected at three times higher than the guideline value while total phosphorous was detected at eight times higher. Algal blooms are possible if these nutrients remain elevated.
Bacteria convert nitrogen compounds such as ammonia into nitrite and nitrate. These compounds can harm aquatic organisms. Ammonia was well below the Australian and New Zealand water quality guidelines for toxicity. While the levels would not be expected to be harmful to fish, the ammonia could promote growth in algae and macrophytes. The ammonia is likely to be from river sources including rotting fish and flood organic matter rather than diffuse inputs from surrounding land.
Algae and algal toxins
There were positive detections in all samples for blue-green algae. However, only the blue-green algae detections found in samples 1, 10, 12 and 14 to 19 were considered potentially toxic. The algal toxin Cylindrospermopsin was detected in samples 1, 2, 10, 12, and 14 to 20.
The algae levels detected fall within the ‘amber’ to ‘red’ alert levels. A ‘red alert’ is in place along parts of the lower Darling-Barka River. An ‘amber alert’ is in place along the Great Darling Anabranch and along the Darling-Barka River, at Menindee and further downstream, as of 29 June 2023.
Pesticides
As noted above, a pesticide screening test that scanned for over 600 pesticides was completed for samples from all three regions. All samples came back negative for pesticide detection.
Metals
Many metals are vital for humans and animals to stay healthy and only pose a risk if they are found at high levels in the environment. Concentrations of key metals found in water are below.
Total metals have been compared to recreational water quality guidelines and dissolved metals have been compared to ecological water quality guidelines as per the National Health and Medical Research Council (NHMRC) recreational and Australian and New Zealand Water Quality (ANZG) guidelines, respectively.
Total metals provide a more conservative estimate of exposure from recreational use whereas dissolved metals are used for ecological assessments as this is the bioavailable fraction of the metal (the part that is toxic to organisms).
|
Metal in Water |
NHMRC (2008)2 |
Samples from the Menindee Weir Pools along the Darling-Barka River |
|||||||
|---|---|---|---|---|---|---|---|---|---|
|
Recreational Water Guidelines |
1 |
2 |
3 |
4 |
5 |
6 |
7 |
8 |
|
|
(mg/L) |
(mg/L) |
(mg/L) |
(mg/L) |
(mg/L) |
(mg/L) |
(mg/L) |
(mg/L) |
(mg/L) |
|
|
Aluminium |
No value |
1.2 |
3.6 |
3.6 |
4.0 |
4.3 |
3.8 |
5.3 |
6.6 |
|
Arsenic |
0.07 |
0.002 |
0.003 |
0.004 |
0.004 |
0.004 |
0.004 |
0.005 |
0.006 |
|
Chromium |
0.5 |
0.001 |
0.004 |
0.004 |
0.004 |
0.004 |
0.004 |
0.005 |
0.007 |
|
Cobalt |
No value |
0.0012 |
0.0021 |
0.0018 |
0.0019 |
0.0019 |
0.0016 |
0.0018 |
0.0016 |
|
Copper |
20 |
0.0021 |
0.0032 |
0.0042 |
0.0042 |
0.0042 |
0.0038 |
0.0051 |
0.0063 |
|
Lead |
0.1 |
0.0007 |
0.0013 |
0.0010 |
0.0011 |
0.0013 |
0.0011 |
0.0013 |
0.0013 |
|
Nickel |
0.2 |
0.0041 |
0.0055 |
0.0059 |
0.0062 |
0.0065 |
0.0060 |
0.0064 |
0.0068 |
|
Zinc |
30 |
0.004 |
0.006 |
0.007 |
0.007 |
0.007 |
0.008 |
0.009 |
0.011 |
2NHMRC (2008) Guidelines for managing risks in recreational waters (10 x drinking water guideline value, Table 9.3)
|
Metal in Water |
NHMRC (2008)2 |
Samples from the Great Darling Anabranch region |
|||
|---|---|---|---|---|---|
|
Recreational Water Guidelines |
9 |
10 |
11 |
12 |
|
|
(mg/L) |
(mg/L) |
(mg/L) |
(mg/L) |
(mg/L) |
|
|
Aluminium |
No value |
3.1 |
4.1 |
2.5 |
4.2 |
|
Arsenic |
0.07 |
0.006 |
0.006 |
0.006 |
0.007 |
|
Chromium |
0.5 |
0.003 |
0.004 |
0.003 |
0.005 |
|
Cobalt |
No value |
0.0008 |
0.0014 |
0.0007 |
0.0017 |
|
Copper |
20 |
0.0045 |
0.0050 |
0.0040 |
0.0047 |
|
Lead |
0.1 |
0.0006 |
0.0010 |
0.0005 |
0.0012 |
|
Nickel |
0.2 |
0.0044 |
0.0051 |
0.0050 |
0.0051 |
|
Zinc |
30 |
0.011 |
0.008 |
0.006 |
0.009 |
2NHMRC (2008) Guidelines for managing risks in recreational waters (10 x drinking water guideline value, Table 9.3)
|
Metal in Water |
NHMRC (2008)2 |
Samples from the lower Darling-Barka River between Weir 32 and Pooncarie (total acid-extractable metals) |
||||||||
|---|---|---|---|---|---|---|---|---|---|---|
|
Recreational Water Guidelines |
13 |
14 |
15 |
16 |
17 |
18 |
19* |
20 |
||
|
(mg/L) |
(mg/L) |
(mg/L) |
(mg/L) |
(mg/L) |
(mg/L) |
(mg/L) |
(mg/L) |
(mg/L) |
||
|
Aluminium |
No value |
5.1 |
5.0 |
4.2 |
5.3 |
4.8 |
4.6 |
14 |
4.6 |
|
|
Arsenic |
0.07 |
0.005 |
0.005 |
0.005 |
0.005 |
0.005 |
0.005 |
0.006 |
0.005 |
|
|
Chromium |
0.5 |
0.006 |
0.006 |
0.004 |
0.006 |
0.005 |
0.005 |
0.015 |
0.005 |
|
|
Cobalt |
No value |
0.0017 |
0.0020 |
0.0019 |
0.0026 |
0.0021 |
0.0020 |
0.0066 |
0.021 |
|
|
Copper |
20 |
0.0050 |
0.0050 |
0.0043 |
0.0062 |
0.0049 |
0.0046 |
0.013 |
0.0048 |
|
|
Lead |
0.1 |
0.0013 |
0.0014 |
0.0012 |
0.0016 |
0.0014 |
0.0014 |
0.0045 |
0.0015 |
|
|
Nickel |
0.2 |
0.0064 |
0.0067 |
0.0060 |
0.0075 |
0.0068 |
0.0066 |
0.013 |
0.0070 |
|
|
Zinc |
30 |
0.009 |
0.010 |
0.007 |
0.010 |
0.009 |
0.009 |
0.024 |
0.009 |
|
2NHMRC (2008) Guidelines for managing risks in recreational waters (10 x drinking water guideline value, Table 9.3)
|
Metal in Water
|
ANZG 20183 |
Samples from the Menindee Weir Pools along the Darling-Barka River |
|||||||
|---|---|---|---|---|---|---|---|---|---|
|
Water Quality Guideline for aquatic ecosystems (95% species protection) |
1 |
2 |
3 |
4 |
5 |
6 |
7 |
8 |
|
|
(mg/L) |
(mg/L) |
(mg/L) |
(mg/L) |
(mg/L) |
(mg/L) |
(mg/L) |
(mg/L) |
(mg/L) |
|
|
Aluminium |
0.055 |
<0.04 |
<0.04 |
<0.04 |
<0.04 |
<0.04 |
<0.04 |
<0.04 |
<0.04 |
|
Arsenic |
0.013 |
0.002 |
0.002 |
0.004 |
0.003 |
0.003 |
0.003 |
0.005 |
0.006 |
|
Cadmium |
0.0002 |
<0.0001 |
<0.0001 |
<0.0001 |
<0.0001 |
<0.0001 |
<0.0001 |
<0.0001 |
<0.0001 |
|
Chromium |
0.001 |
<0.001 |
<0.001 |
<0.001 |
<0.001 |
<0.001 |
<0.001 |
<0.001 |
<0.001 |
|
Cobalt |
No value |
0.0002 |
0.0002 |
0.0002 |
0.0002 |
0.0002 |
0.0002 |
0.0002 |
0.0001 |
|
Copper |
0.0014 |
0.0011 |
0.0010 |
0.0020 |
0.0020 |
0.0019 |
0.0017 |
0.0021 |
0.0029 |
|
Lead |
0.0034 |
<0.0001 |
<0.0001 |
<0.0001 |
<0.0001 |
<0.0001 |
<0.0001 |
<0.0001 |
<0.0001 |
|
Manganese |
1.9 |
<0.001 |
<0.001 |
<0.001 |
<0.001 |
<0.001 |
<0.001 |
<0.001 |
<0.001 |
|
Nickel |
0.011 |
0.0028 |
0.0029 |
0.0031 |
0.0034 |
0.0033 |
0.0034 |
0.0029 |
0.0023 |
|
Selenium |
0.005 |
<0.005 |
<0.005 |
<0.005 |
<0.005 |
<0.005 |
<0.005 |
<0.005 |
<0.005 |
|
Silver |
0.0005 |
<0.0001 |
<0.0001 |
<0.0001 |
<0.0001 |
<0.0001 |
<0.0001 |
<0.0001 |
<0.0001 |
|
Zinc |
0.008 |
<0.001 |
<0.001 |
<0.001 |
<0.001 |
<0.001 |
<0.001 |
<0.001 |
<0.001 |
3ANZG (2018). Australian and New Zealand Guidelines for Fresh and Marine Water Quality. Australian and New Zealand Governments and Australian state and territory governments, Canberra ACT, Australia.
*Sample 19 measured higher than usual levels of some total acid-extractable metals on this sampling occasion. However, the measured values are still below recreational water quality guidelines, and the dissolved metals in this sample remain low.
|
Metal in Water
|
ANZG 20183 |
Samples from the Great Darling Anabranch region |
|||
|---|---|---|---|---|---|
|
Water Quality Guideline for aquatic ecosystems (95% species protection) |
9 |
10 |
11 |
12 |
|
|
(mg/L) |
(mg/L) |
(mg/L) |
(mg/L) |
(mg/L) |
|
|
Aluminium |
0.055 |
<0.04 |
<0.04 |
<0.04 |
<0.04 |
|
Arsenic |
0.013 |
0.006 |
0.006 |
0.006 |
0.007 |
|
Cadmium |
0.0002 |
<0.0001 |
<0.0001 |
<0.0001 |
<0.0001 |
|
Chromium |
0.001 |
<0.001 |
<0.001 |
<0.001 |
<0.001 |
|
Cobalt |
No value |
<0.0001 |
0.0002 |
<0.0001 |
0.0002 |
|
Copper |
0.0014 |
0.0024 |
0.0021 |
0.0024 |
0.0018 |
|
Lead |
0.0034 |
<0.0001 |
<0.0001 |
<0.0001 |
<0.0001 |
|
Manganese |
1.9 |
<0.001 |
<0.001 |
<0.001 |
<0.001 |
|
Nickel |
0.011 |
0.0021 |
0.0022 |
0.0022 |
0.0020 |
|
Selenium |
0.005 |
<0.005 |
<0.005 |
<0.005 |
<0.005 |
|
Silver |
0.0005 |
<0.0001 |
<0.0001 |
<0.0001 |
<0.0001 |
|
Zinc |
0.008 |
<0.001 |
<0.001 |
<0.001 |
<0.001 |
3ANZG (2018). Australian and New Zealand Guidelines for Fresh and Marine Water Quality. Australian and New Zealand Governments and Australian state and territory governments, Canberra ACT, Australia.
|
Metal in Water
|
ANZG 20183 |
Samples from the lower Darling-Barka River between Weir 32 and Pooncarie (dissolved metals) |
|||||||
|---|---|---|---|---|---|---|---|---|---|
|
Water Quality Guideline for aquatic ecosystems (95% species protection) |
13 |
14 |
15 |
16 |
17 |
18 |
19 |
20 |
|
|
(mg/L) |
(mg/L) |
(mg/L) |
(mg/L) |
(mg/L) |
(mg/L) |
(mg/L) |
(mg/L) |
(mg/L) |
|
|
Aluminium |
0.055 |
<0.04 |
<0.04 |
<0.04 |
<0.04 |
<0.04 |
<0.04 |
<0.04 |
<0.04 |
|
Arsenic |
0.013 |
0.005 |
0.005 |
0.004 |
0.005 |
0.005 |
0.004 |
0.004 |
0.005 |
|
Cadmium |
0.0002 |
<0.0001 |
<0.0001 |
<0.0001 |
<0.0001 |
<0.0001 |
<0.0001 |
<0.0001 |
<0.0001 |
|
Chromium |
0.001 |
<0.001 |
<0.001 |
<0.001 |
<0.001 |
<0.001 |
<0.001 |
<0.001 |
<0.001 |
|
Cobalt |
No value |
0.0002 |
0.0002 |
0.0003 |
0.0003 |
0.0003 |
0.0002 |
0.0003 |
0.0003 |
|
Copper |
0.0014 |
0.0022 |
0.0023 |
0.0020 |
0.0021 |
0.0019 |
0.0018 |
0.0022 |
0.0018 |
|
Lead |
0.0034 |
<0.0001 |
<0.0001 |
<0.0001 |
<0.0001 |
<0.0001 |
<0.0001 |
<0.0001 |
<0.0001 |
|
Manganese |
1.9 |
<0.001 |
<0.001 |
<0.001 |
<0.001 |
<0.001 |
<0.001 |
<0.001 |
<0.001 |
|
Nickel |
0.011 |
0.0027 |
0.0029 |
0.0032 |
0.0030 |
0.0031 |
0.0032 |
0.0036 |
0.0037 |
|
Selenium |
0.005 |
<0.005 |
<0.005 |
<0.005 |
<0.005 |
<0.005 |
<0.005 |
<0.005 |
<0.005 |
|
Silver |
0.0005 |
<0.0001 |
<0.0001 |
<0.0001 |
<0.0001 |
<0.0001 |
<0.0001 |
<0.0001 |
<0.0001 |
|
Zinc |
0.008 |
<0.001 |
<0.001 |
<0.001 |
<0.001 |
<0.001 |
<0.001 |
<0.001 |
<0.001 |
3ANZG (2018). Australian and New Zealand Guidelines for Fresh and Marine Water Quality. Australian and New Zealand Governments and Australian state and territory governments, Canberra ACT, Australia.
References
ANZG (2018), Australian and New Zealand Guidelines for Fresh and Marine Water Quality, Australian and New Zealand Governments and Australian state and territory governments, Canberra ACT, Australia. Available at www.waterquality.gov.au/anz-guidelines
Basin Plan (2012), Schedule 11, Water Act 2007, Murray-Darling Basin Authority, Commonwealth of Australia
NHMRC (2008), Guidelines for managing risks in recreational waters, Australian Government National Health and Medical Research Council
Download the full test results
9 May results
- Report for metals and pesticides – 9 May, Menindee weir pools (PDF 1MB)
- Report for algal toxins – 9 May, Menindee weir pools (PDF 161KB)
- Report for algal identification and cell count – 9 May, Menindee weir pools (PDF 202KB)
- Report for nutrients, glyphosate and phenoxyherbicides – 9 May, Menindee (PDF 692KB)
10 May results
- Report for metals and pesticides – 10 May, Great Darling Anabranch and Lower Darling-Barka River (PDF 1MB)
- Report for algal toxins – 10 May, Great Darling Anabranch and Lower Darling-Barka River (PDF 161KB)
- Report for algal identification and cell count – 10 May, Great Darling Anabranch and Lower Darling-Barka River (PDF 202KB)
- Report for nutrients, glyphosate and phenoxyherbicides – 10 May, Great Darling Anabranch and Lower Darling-Barka River (PDF 692KB)
11 May results
- Report for metals and pesticides – 11 May, Lower Darling-Barka River (PDF 1MB)
- Report for algal toxins – 11 May, Lower Darling-Barka River (PDF 161KB)
- Report for algal identification and cell count – 11 May, Lower Darling-Barka River (PDF 202KB)
- Report for nutrients, glyphosate and phenoxyherbicides – 11 May, Lower Darling-Barka River (PDF 692KB)
The Department of Planning and Environment (DPE) and the NSW Environment Protection Authority (EPA) collected fifteen water samples between 6 and 7 May 2023 at Menindee along the Darling-Barka River, downstream along the lower Darling-Barka River, and along the Great Darling Anabranch.
Samples were checked for pesticides, excess nitrogen and phosphorus, ammonia, algae and algal toxins. Due to some logistics challenges, there were not enough sample containers for the full suite of testing in this sampling round. Metals and some pesticides were not tested due to insufficient number of sample containers. These have not been detected previously in this monitoring program at levels that would be toxic to fish.
Summary
Pesticides
Samples were scanned for a range of common pesticides. None were detected.
Nitrogen and phosphorus
Nitrogen and phosphorous levels are high. If nitrogen and phosphorus stay high they can cause algal blooms.
Algae and algal toxins
Blue-green algae were detected in all samples, but potentially toxic blue-green algae were detected in nine of the fifteen samples. The algal toxin Cylindrospermopsin was detected in seven samples across all regions.
A ‘red alert’ is in place along parts of the lower Darling-Barka River. An ‘amber alert’ is in place along the Great Darling Anabranch and along the Darling-Barka River, at Menindee and further downstream, as of 29 June 2023. See WaterNSW for information about red alerts
Sample locations
Water was sampled between 6 and 7 May 2023 from fifteen locations on the Darling-Barka River at Menindee, downstream along the lower Darling-Barka River, and along the Great Darling Anabranch.
On 6 May 2023, eight samples were collected from the Menindee Weir Pools in the Darling-Barka River. The correlating sample identifications are given in brackets for reference to the full laboratory report data.
- Sample 1 (B1) – Lake Wetherell upstream of the Main Weir
- Sample 2 (B2) – Outlet of Lake Pamamaroo into Darling River
- Sample 3 (E1) – Upper weir pool
- Sample 4 (E2) – Mid weir pool
- Sample 5 (E3) – Menindee town
- Sample 6 (E4) – Downstream Menindee town
- Sample 7 (E5) – Lower weir pool downstream Lake Menindee inflow
- Sample 8 (B3) – Outlet of Lake Menindee into Darling-Barka River
On 7 May 2023, four samples were collected from the Great Darling Anabranch region and three samples from the Lower Darling-Barka River between Weir 32 and Pooncarie.
- Sample 9 (B4) – Lake Cawndilla outlet into the anabranch of Darling River
- Sample 10 (E6) – Redbank Creek upstream of Cawndilla Channel confluence
- Sample 11 (E6.5) – Tandou Creek at Tandou Woolshed Rd (incorporating inflows from Kangaroo Lake)
- Sample 12 (E7) – Tandou Creek at Packers Crossing (incorporating inflows from Packers Lake)
- Sample 13 (E8) – Kinchega National Park upper
- Sample 14 (E9) – Kinchega National Park mid (incorporating inflows from Emu Lake)
- Sample 15 (E10) – Kinchega National Park lower (upstream of Anabranch offtake)
Figure 1: Sample locations where samples were taken between 6 and 7 May 2023.

More sampling
The DPE and EPA are conducting regular water quality monitoring on the Darling-Barka River from upstream of Menindee to Pooncarie as well as the Great Darling Anabranch. The test results from these samples will also be published on this website.
In-field measurements
At the time of sampling, the EPA collected in-field measurements for pH, dissolved oxygen, conductivity, temperature and turbidity.
pH was outside the guideline value for all samples in the Great Darling Anabranch region.
All other parameters were within the expected ranges.
| Sample | Location | Temp (°C) | Dissolved oxygen (mg/L) | Electrical conductivity (µS/cm) | pH | Turbidity (NTU) |
|---|---|---|---|---|---|---|
|
1 (B1) |
Lake Wetderell upstream of tde Main Weir |
17.3 |
5.5 |
562 |
8.2 |
18.7 |
|
2 (B2) |
Outlet of Lake Pamamaroo into Darling River |
16.9 |
7.0 |
469 |
8.2 |
38.6 |
|
3 (E1) |
Upper weir pool |
17.1 |
7.6 |
456 |
8.3 |
41.4 |
|
4 (E2) |
Mid weir pool |
17.2 |
7.1 |
442 |
8.2 |
50.8 |
|
5 (E3) |
Menindee town |
17.7 |
6.4 |
472 |
8.1 |
47.0 |
|
6 (E4) |
Downstream Menindee town |
18.1 |
7.9 |
510 |
8.3 |
38.4 |
|
7 (E5) |
Lower weir pool downstream Lake Menindee inflow |
16.8 |
6.1 |
429 |
8.0 |
61.4 |
|
8 (B3) |
Outlet of Lake Menindee into Darling-Barka River |
16.3 |
9.3 |
348 |
8.5 |
83.8 |
|
9 (B4) |
Lake Cawndilla outlet into tde anabranch of Darling River |
16.3 |
9.7 |
375 |
8.6 |
28.1 |
|
10 (E6) |
Redbank Creek upstream of Cawndilla Channel confluence |
14.5 |
10.7 |
375 |
9.0 |
22.9 |
|
11 (E6.5) |
Tandou Creek at Tandou Woolshed Rd (incorporating inflows from Kangaroo Lake) |
14.8 |
10.9 |
364 |
8.8 |
38.2 |
|
12 (E7) |
Tandou Creek at Packers Crossing (incorporating inflows from Packers Lake) |
16.1 |
7.9 |
394 |
8.6 |
46.9 |
|
13 (E8) |
Kinchega National Park upper |
16.2 |
7.4 |
424 |
8.0 |
47.1 |
|
14 (E9) |
Kinchega National Park mid (incorporating inflows from Emu Lake) |
15.6 |
7.2 |
417 |
8.1 |
50.6 |
|
15 (E10) |
Kinchega National Park lower (upstream of anabranch offtake) |
15.7 |
6.9 |
420 |
8.1 |
50.0 |
Nitrogen, phosphorus and ammonia
Sample results show that total nitrogen and total phosphorous are higher than the acceptable levels given for lowland river ecosystems in NSW (ANZG 2018, which are in agreement with the regionally specific set of guideline values for the Murray-Darling outlined in the Basin Plan 2012). Total nitrogen was detected at four times higher than the guideline value, while total phosphorous was detected at eight times higher. Algal blooms are possible if these nutrients remain elevated.
Bacteria convert nitrogen compounds such as ammonia into nitrite and nitrate. These compounds can harm aquatic organisms. Ammonia was well below the Australian and New Zealand water quality guidelines for toxicity. While the levels would not be expected to be harmful to fish, the ammonia could promote growth in algae and macrophytes. The ammonia is likely to be from river sources including rotting fish and flood organic matter rather than diffuse inputs from surrounding land.
Algae and algal toxins
There were positive detections in all samples for a range of blue-green algae. However, the blue-green algae detections found in samples 1, 2, 3, 7, 8 and 9 from the Menindee and Great Darling Anabranch regions were not considered potentially toxic. The algal toxin Cylindrospermopsin was detected in samples 1, 2, 6, 10, 12, 14 and 15 across all regions.
The algae levels detected fall within the ‘amber’ to ‘red’ alert levels. A ‘red alert’ is in place along parts of the lower Darling-Barka River. An ‘amber alert’ is in place along the Great Darling Anabranch and along the Darling-Barka River, at Menindee and further downstream, as of 29 June 2023.
Pesticides
As noted above, a pesticide screening test that scanned for a range of common pesticides was completed for samples from all three regions. All samples came back negative for pesticide detection.
References
ANZG (2018), Australian and New Zealand Guidelines for Fresh and Marine Water Quality, Australian and New Zealand Governments and Australian state and territory governments, Canberra ACT, Australia. Available at www.waterquality.gov.au/anz-guidelines
Basin Plan (2012), Schedule 11, Water Act 2007, Murray-Darling Basin Authority, Commonwealth of Australia
Download the full test results
6 May results
- Report summary – 6 May, Menindee weir pools (PDF 1MB)
- Report for algal toxins – 6 May, Menindee weir pools (PDF 161KB)
- Report for algal identification and cell count – 6 May, Menindee weir pools (PDF 202KB)
- Report for nutrients – 6 May, Menindee weir pools (PDF 692KB)
- Report for glyphosate and phenoxyherbicides – 6 May, Menindee weir pools (PDF 695KB)
7 May results
- Report summary – 7 May, Great Darling Anabranch and Lower Darling-Barka River (PDF 1MB)
- Report for algal toxins – 7 May, Great Darling Anabranch and Lower Darling-Barka River (PDF 161KB)
- Report for algal identification and cell count – 7 May, Great Darling Anabranch and Lower Darling-Barka River (PDF 202KB)
- Report for nutrients – 7 May, Great Darling Anabranch and Lower Darling-Barka River (PDF 692KB)
- Report for glyphosate and phenoxyherbicides – 7 May, Great Darling Anabranch and Lower Darling-Barka River (PDF 695KB)
The Department of Planning and Environment (DPE) and the NSW Environment Protection Authority (EPA) collected twenty water samples between 3 and 5 May 2023 at Menindee along the Darling-Barka River, downstream along the lower Darling-Barka River, and along the Great Darling Anabranch.
Samples were checked for pesticides, excess nitrogen and phosphorus, ammonia, algae and algal toxins. Due to some logistics challenges, there were not enough sample containers for the full suite of testing in this sampling round. Metals and some pesticides were not tested due to insufficient number of sample containers. These have not been detected previously in this monitoring program at levels that would be toxic to fish.
Summary
Pesticides
Samples were scanned for a range of common pesticides. None were detected.
Nitrogen and phosphorus
Nitrogen and phosphorous levels are high. If nitrogen and phosphorus stay high they can cause algal blooms.
Algae and algal toxins
Potentially toxic blue-green algae was detected in thirteen of the samples. All samples had detections of algae that are not considered potentially toxic. The algal toxin Cylindrospermopsin was detected in all except five samples.
A ‘red alert’ is in place along parts of the lower Darling-Barka River. An ‘amber alert’ is in place along the Great Darling Anabranch and along the Darling-Barka River, at Menindee and further downstream, as of 29 June 2023. See WaterNSW for information about red alerts
Sample locations
Water was sampled between 3 and 5 May 2023 from twenty locations on the Darling-Barka River at Menindee, downstream along the lower Darling-Barka River, and along the Great Darling Anabranch.
On 3 May 2023, eight samples were collected from the Menindee Weir Pools in the Darling-Barka River. The correlating sample identifications are given in brackets for reference to the full laboratory report data.
- Sample 1 (B1) – Lake Wetherell upstream of the Main Weir
- Sample 2 (B2) – Outlet of Lake Pamamaroo into Darling River
- Sample 3 (E1) – Upper weir pool
- Sample 4 (E2) – Mid weir pool
- Sample 5 (E3) – Menindee town
- Sample 6 (E4) – Downstream Menindee town
- Sample 7 (E5) – Lower weir pool downstream Lake Menindee inflow
- Sample 8 (B3) – Outlet of Lake Menindee into Darling-Barka River
On 4 May 2023, four samples were collected from the Great Darling Anabranch region and three samples from the Lower Darling-Barka River between Weir 32 and Pooncarie.
- Sample 9 (B4) – Lake Cawndilla outlet into the anabranch of Darling River
- Sample 10 (E6) – Redbank Creek upstream of Cawndilla Channel confluence
- Sample 11 (E6.5) – Tandou Creek at Tandou Woolshed Rd (incorporating inflows from Kangaroo Lake)
- Sample 12 (E7) – Tandou Creek at Packers Crossing (incorporating inflows from Packers Lake)
- Sample 13 (E8) – Kinchega National Park upper
- Sample 14 (E9) – Kinchega National Park mid (incorporating inflows from Emu Lake)
- Sample 15 (E10) – Kinchega National Park lower (upstream of Anabranch offtake)
On 5 May 2023, five samples were collected from the Lower Darling-Barka River between Weir 32 and Pooncarie.
- Sample 16 (E11) – Bindara Station reach
- Sample 17 (E12) – Karoola Station reach
- Sample 18 (E13) – Coona Point reach
- Sample 19 (E14) – Mullingar Station reach
- Sample 20 (E15) – Old wharf at Pooncarie
Figure 1: Sample locations where samples were taken between 3 to 5 May 2023. See Figures 2 and 3 below for more detail.

Figure 2: Sample locations for the Menindee Weir Pools region along the Darling-Barka River
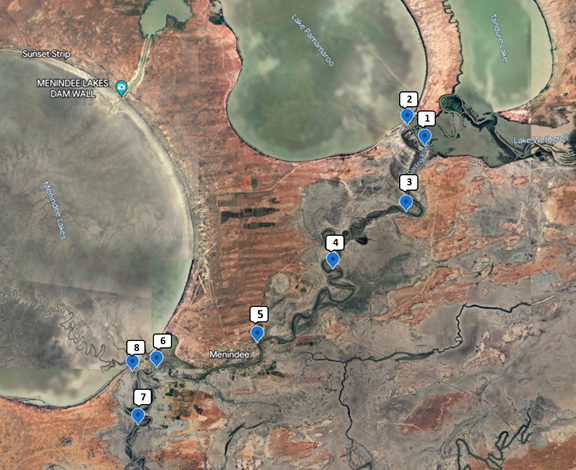
Figure 3: Sample locations for the Great Darling Anabranch and lower Darling-Barka river between Weir 32 and Pooncarie regions
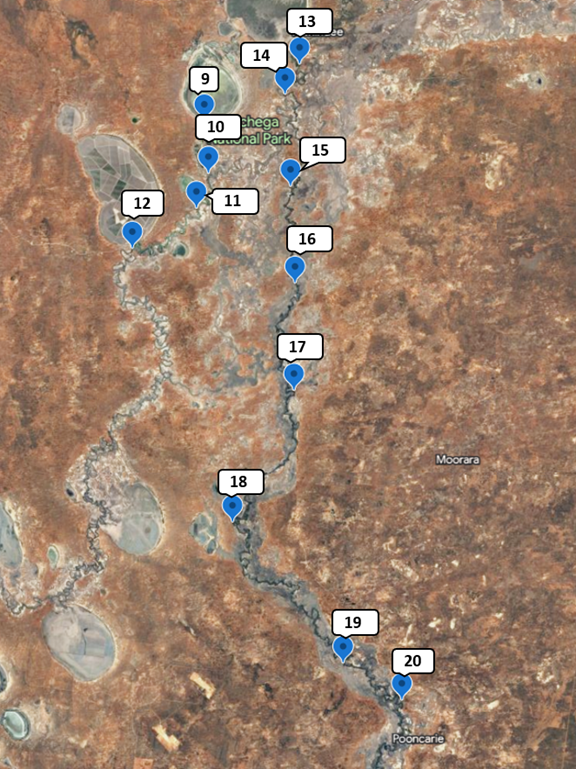
More sampling
The DPE and EPA are conducting regular water quality monitoring on the Darling-Barka River from upstream of Menindee to Pooncarie as well as the Great Darling Anabranch. The test results from these samples will also be published on this website.
In-field measurements
At the time of sampling, the EPA collected in-field measurements for pH, dissolved oxygen, conductivity, temperature and turbidity.
pH was outside the guideline value for all samples in the Great Darling Anabranch region.
All other parameters were within the expected ranges.
|
Sample |
Location |
Temp (°C) |
Dissolved oxygen (mg/L) |
Electrical conductivity (µS/cm) |
pH |
Turbidity (NTU) |
|---|---|---|---|---|---|---|
|
1 (B1) |
Lake Wetherell upstream of the Main Weir |
18.0 |
6.2 |
568 |
8.2 |
17.1 |
|
2 (B2) |
Outlet of Lake Pamamaroo into Darling River |
17.0 |
8.9 |
427 |
8.4 |
57.1 |
|
3 (E1) |
Upper weir pool |
17.5 |
6.8 |
448 |
8.2 |
67.2 |
|
4 (E2) |
Mid weir pool |
17.7 |
5.8 |
496 |
8.0 |
49.5 |
|
5 (E3) |
Menindee town |
18.4 |
5.2 |
499 |
8.0 |
47.3 |
|
6 (E4) |
Downstream Menindee town |
18.6 |
4.2 |
526 |
7.9 |
39 |
|
7 (E5) |
Lower weir pool downstream Lake Menindee inflow |
18.1 |
6.4 |
398 |
8.1 |
57.5 |
|
8 (B3) |
Outlet of Lake Menindee into Darling-Barka River |
16.8 |
9.4 |
351 |
8.5 |
97.6 |
|
9 (B4) |
Lake Cawndilla outlet into the anabranch of Darling River |
18.0 |
9.6 |
390 |
8.6 |
25.1 |
|
10 (E6) |
Redbank Creek upstream of Cawndilla Channel confluence |
16.8 |
7.3 |
393 |
8.7 |
27.4 |
|
11 (E6.5) |
Tandou Creek at Tandou Woolshed Rd (incorporating inflows from Kangaroo Lake) |
18.0 |
10.6 |
392 |
8.7 |
33.6 |
|
12 (E7) |
Tandou Creek at Packers Crossing (incorporating inflows from Packers Lake) |
18.0 |
7.5 |
415 |
8.7 |
41.9 |
|
13 (E8) |
Kinchega National Park upper |
17.4 |
7.1 |
443 |
8.0 |
49.9 |
|
14 (E9) |
Kinchega National Park mid (incorporating inflows from Emu Lake) |
17.2 |
6.8 |
441 |
8.1 |
49.2 |
|
15 (E10) |
Kinchega National Park lower (upstream of Anabranch offtake) |
17.2 |
6.5 |
441 |
8.0 |
54.8 |
|
16 (E11) |
Bindara Station reach |
17.0 |
7.0 |
439 |
8.0 |
52.1 |
|
17 (E12) |
Karoola Station reach |
16.5 |
6.4 |
424 |
7.9 |
57.0 |
|
18 (E13) |
Coona Point reach |
16.9 |
7.2 |
442 |
7.9 |
51.3 |
|
19 (E14) |
Mullingar Station reach |
17.1 |
7.0 |
434 |
7.9 |
49.2 |
|
20 (E15) |
Old wharf at Pooncarie |
16.5 |
6.3 |
422 |
7.9 |
60.3 |
Nitrogen, phosphorus and ammonia
Sample results show that total nitrogen and total phosphorous are higher than the acceptable levels given for lowland river ecosystems in NSW (ANZG 2018, which are in agreement with the regionally specific set of guideline values for the Murray-Darling outlined in the Basin Plan 2012). Total nitrogen was detected at four times higher than the guideline value while total phosphorous was detected at seven times higher. Algal blooms are possible if these nutrients remain elevated.
Bacteria convert nitrogen compounds such as ammonia into nitrite and nitrate. These compounds can harm aquatic organisms. Ammonia was well below the Australian and New Zealand water quality guidelines for toxicity. While the levels would not be expected to be harmful to fish, the ammonia could promote growth in algae and macrophytes. The ammonia is likely to be from river sources including rotting fish and flood organic matter rather than diffuse inputs from surrounding land.
Algae and algal toxins
A wide variety of algae was tested for. There were positive detections in all samples for a range of algal species, including blue-green algae. However, only the algae detections found in samples 1, 4, 6, 10 and 12 to 20 were considered potentially toxic. The algal toxin Cylindrospermopsin was detected in all samples except samples 2, 7, 8, 9 and 11.
The algae levels detected fall within the ‘amber’ to ‘red’ alert levels. A ‘red alert’ is in place along parts of the lower Darling-Barka River. An ‘amber alert’ is in place along the Great Darling Anabranch and along the Darling-Barka River, at Menindee and further downstream, as of 29 June 2023.
Pesticides
As noted above, a pesticide screening test that scanned for a range of common pesticides was completed for samples from all three regions. All samples came back negative for pesticide detection.
References
ANZG (2018), Australian and New Zealand Guidelines for Fresh and Marine Water Quality, Australian and New Zealand Governments and Australian state and territory governments, Canberra ACT, Australia. Available at www.waterquality.gov.au/anz-guidelines
Basin Plan (2012), Schedule 11, Water Act 2007, Murray-Darling Basin Authority, Commonwealth of Australia
Download the full test results
3 May results
- Report summary – 3 May, Menindee weir pools (PDF 1.5MB)
- Report for algal toxins – 3 May, Menindee weir pools (PDF 180KB)
- Report for algal identification and cell count – 3 May, Menindee weir pools (PDF 206KB)
- Report for nutrients – 3 May, Menindee weir pools (PDF 695KB)
- Report for glyphosate and phenoxyherbicides – 3 May, Menindee weir pools (PDF 695KB)
4 May results
- Report summary – 4 May, Great Darling Anabranch and Lower Darling-Barka River (PDF 1MB)
- Report for algal toxins – 4 May, Great Darling Anabranch and Lower Darling-Barka River (PDF 161KB)
- Report for algal identification and cell count – 4 May, Great Darling Anabranch and Lower Darling-Barka River (PDF 202KB)
- Report for nutrients – 4 May, Great Darling Anabranch and Lower Darling-Barka River (PDF 692KB)
- Report for glyphosate and phenoxyherbicides – 4 May, Great Darling Anabranch and Lower Darling-Barka River (PDF 695KB)
5 May results
- Report summary – 5 May, Great Darling Anabranch and Lower Darling-Barka River (PDF 1MB)
- Report for algal toxins – 5 May, Lower Darling-Barka River (PDF 161KB)
- Report for algal identification and cell count – 5 May, Lower Darling-Barka River (PDF 202KB)
- Report for nutrients – 5 May, Lower Darling-Barka River (PDF 692KB)
- Report for glyphosate and phenoxyherbicides – 5 May, Lower Darling-Barka River (PDF 695KB)
The Department of Planning and Environment (DPE) and the NSW Environment Protection Authority (EPA) collected fifteen water samples between 30 April and 1 May 2023 at Menindee along the Darling-Barka River, downstream along the lower Darling-Barka River, and along the Great Darling Anabranch.
Samples were checked for pesticides, excess nitrogen and phosphorus, ammonia, metals, algae and algal toxins.
Summary
Pesticides
Samples were scanned for more than 600 pesticides. None were detected.
Nitrogen and phosphorus
Nitrogen and phosphorous levels are high. If nitrogen and phosphorus stay high they can cause algal blooms.
Algae and algal toxins
Algae, including blue-green algae, was detected in all samples. Potentially toxic blue green algae was detected in all except four samples from the Menindee and Great Darling Anabranch regions. The algal toxin Cylindrospermopsin was detected in all except five samples across all regions.
A ‘red alert’ is in place along parts of the lower Darling-Barka River. An ‘amber alert’ is in place along the Great Darling Anabranch and along the Darling-Barka River, at Menindee and further downstream, as of 29 June 2023. See WaterNSW for information about red alerts
Metals
Copper is slightly above the level set to protect water life in eight samples across all regions, but well below the level harmful to fish. All other metals were under the levels set to protect water life.
Sample locations
Water was sampled between 30 April and 1 May 2023 from fifteen locations on the Darling-Barka River at Menindee, downstream along the lower Darling-Barka River, and along the Great Darling Anabranch.
On 30 April 2023, eight samples were collected from the Menindee Weir Pools in the Darling-Barka River. The correlating sample identifications are given in brackets for reference to the full laboratory report data.
- Sample 1 (B1) – Lake Wetherell upstream of the Main Weir
- Sample 2 (B2) – Outlet of Lake Pamamaroo into Darling River
- Sample 3 (E1) – Upper weir pool
- Sample 4 (E2) – Mid weir pool
- Sample 5 (E3) – Menindee town
- Sample 6 (E4) – Downstream Menindee town
- Sample 7 (E5) – Lower weir pool downstream Lake Menindee inflow
- Sample 8 (B3) – Outlet of Lake Menindee into Darling-Barka River
On 1 May 2023, four samples were collected from the Great Darling Anabranch region and three samples from the Lower Darling-Barka River between Weir 32 and Pooncarie.
- Sample 9 (B4) – Lake Cawndilla outlet into the anabranch of Darling River
- Sample 10 (E6) – Redbank Creek upstream of Cawndilla Channel confluence
- Sample 11 (E.6) – Tandou Creek at Tandou Woolshed Rd (incorporating inflows from Kangaroo Lake)
- Sample 12 (E7) – Tandou Creek at Packers Crossing (incorporating inflows from Packers Lake)
- Sample 13 (E8) – Kinchega National Park upper
- Sample 14 (E9) – Kinchega National Park mid (incorporating inflows from Emu Lake)
- Sample 15 (E10) – Kinchega National Park lower (upstream of Anabranch offtake)
Figure 1: Sample locations where samples were taken between 30 April to 1 May 2023.

More sampling
The DPE and EPA are conducting regular water quality monitoring on the Darling-Barka River from upstream of Menindee to Pooncarie as well as the Great Darling Anabranch. The test results from these samples will also be published on this website.
In-field measurements
At the time of sampling, the EPA collected in-field measurements for pH, dissolved oxygen, conductivity, temperature and turbidity.
Sample 10, collected from the Great Darling Anabranch region at Redbank Creek, was saturated with oxygen, had a high pH, and had very high nutrient load. When water holds as much dissolved oxygen as it can at a specific temperature, it is said to be saturated with oxygen. The oxygen saturation and nutrient load is likely due to a cyanobacteria bloom at the time. The sample location is adjacent to a complex wetland system and is prone to high variability in water quality. All other parameters are within the expected ranges.
| Sample | Location | Temp (°C) | Dissolved oxygen (mg/L) | Electrical conductivity (µS/cm) | pH | Turbidity (NTU) |
|---|---|---|---|---|---|---|
|
1 (B1) |
Lake Wetherell upstream of the Main Weir |
18.5 |
4.1 |
554 |
8.0 |
25.1 |
|
2 (B2) |
Outlet of Lake Pamamaroo into Darling River |
17.7 |
7.9 |
504 |
8.2 |
44.5 |
|
3 (E1) |
Upper weir pool |
18.5 |
7.3 |
516 |
8.2 |
39.4 |
|
4 (E2) |
Mid weir pool |
18.8 |
6.9 |
514 |
8.2 |
38.9 |
|
5 (E3) |
Menindee town |
19.9 |
7.8 |
494 |
8.3 |
32.1 |
|
6 (E4) |
Downstream Menindee town |
19.3 |
6.6 |
523 |
8.1 |
37.6 |
|
7 (E5) |
Lower weir pool downstream Lake Menindee inflow |
17.9 |
6.5 |
431 |
8.1 |
75.2 |
|
8 (B3) |
Outlet of Lake Menindee into Darling-Barka River |
16.7 |
9.5 |
347 |
8.6 |
90.9 |
|
9 (B4) |
Lake Cawndilla outlet into the anabranch of Darling River |
17.1 |
9.1 |
382 |
8.6 |
40.1 |
|
10 (E6) |
Redbank Creek upstream of Cawndilla Channel confluence |
19.5 |
15.3 |
434 |
9.5 |
25.5 |
|
11 (E6.5) |
Tandou Creek at Tandou Woolshed Rd (incorporating inflows from Kangaroo Lake) |
17.4 |
9.4 |
388 |
8.5 |
48.9 |
|
12 (E7) |
Tandou Creek at Packers Crossing (incorporating inflows from Packers Lake) |
18.2 |
6.8 |
416 |
8.6 |
58.1 |
|
13 (E8) |
Kinchega National Park upper |
17.4 |
7.1 |
433 |
7.9 |
73.0 |
|
14 (E9) |
Kinchega National Park mid (incorporating inflows from Emu Lake) |
17.2 |
7.0 |
426 |
8.0 |
77.8 |
|
15 (E10) |
Kinchega National Park lower (upstream of anabranch offtake) |
17.3 |
6.7 |
431 |
7.9 |
78.9 |
Nitrogen, phosphorus and ammonia
Sample results show that total nitrogen and total phosphorous are higher than the acceptable levels given for lowland river ecosystems in NSW (ANZG 2018, which are in agreement with the regionally specific set of guideline values for the Murray-Darling outlined in the Basin Plan 2012). Total nitrogen was detected at typically up to four times higher than the guideline value, with the exception of sample 10 at Redbank Creek upstream of Cawndilla Channel confluence, which was 9 times higher, while total phosphorous was detected at eleven times higher. Algal blooms are possible if these nutrients remain elevated.
Bacteria convert nitrogen compounds such as ammonia into nitrite and nitrate. These compounds can harm aquatic organisms. Ammonia was well below the Australian and New Zealand water quality guidelines for toxicity. While the levels would not be expected to be harmful to fish, the ammonia could promote growth in algae and macrophytes. The ammonia is likely to be from river sources including rotting fish and flood organic matter rather than diffuse inputs from surrounding land.
Algae and algal toxins
A wide variety of algae was tested for. There were positive detections in all samples for a range of algal species, including blue-green algae. However, the algae detections found in samples 2, 8, 11 and 13 were not considered potentially toxic. The algal toxin Cylindrospermopsin was detected in all samples except samples 7, 8, 9, 11 and 13.
The algae levels detected fall within the ‘amber’ to ‘red’ alert levels. A ‘red alert’ is in place along parts of the lower Darling-Barka River. An ‘amber alert’ is in place along the Great Darling Anabranch and along the Darling-Barka River, at Menindee and further downstream, as of 29 June 2023.
Pesticides
As noted above, a pesticide screening test that scanned for over 600 pesticides was completed for samples from all three locations. All samples came back negative for pesticide detection.
Metals
Many metals are vital for humans and animals to stay healthy and only pose a risk if they are found at high levels in the environment. Concentrations of key metals found in water are below.
Total metals have been compared to recreational water quality guidelines and dissolved metals have been compared to ecological water quality guidelines as per the National Health and Medical Research Council (NHMRC) recreational and Australian and New Zealand Water Quality (ANZG) guidelines, respectively.
Total metals provide a more conservative estimate of exposure from recreational use whereas dissolved metals are used for ecological assessments as this is the bioavailable fraction of the metal (the part that is toxic to organisms).
| Metal in Water | NHMRC (2008)2 | Samples from the Menindee Weir Pools in the Darling-Barka River (total acid-extractable metals) | |||||||
|---|---|---|---|---|---|---|---|---|---|
| Recreational Water Guidelines | 1 | 2 | 3 | 4 | 5 | 6 | 7 | 8 | |
| (mg/L) | (mg/L) | (mg/L) | (mg/L) | (mg/L) | (mg/L) | (mg/L) | (mg/L) | (mg/L) | |
|
Aluminium |
No value |
1.5 |
3.4 |
2.9 |
2.7 |
2.1 |
2.4 |
5.7 |
8.4 |
|
Arsenic |
0.07 |
0.002 |
0.003 |
0.003 |
0.003 |
0.003 |
0.003 |
0.005 |
0.006 |
|
Chromium |
0.5 |
0.002 |
0.004 |
0.003 |
0.003 |
0.002 |
0.002 |
0.005 |
0.008 |
|
Cobalt |
No value |
0.0013 |
0.0017 |
0.0015 |
0.0015 |
0.0014 |
0.0015 |
0.0019 |
0.0020 |
|
Copper |
20 |
0.0032 |
0.0033 |
0.0029 |
0.0030 |
0.0025 |
0.0026 |
0.0047 |
0.0066 |
|
Lead |
0.1 |
0.0008 |
0.0010 |
0.0009 |
0.0009 |
0.0009 |
0.0010 |
0.0013 |
0.0016 |
|
Nickel |
0.2 |
0.0040 |
0.0055 |
0.0052 |
0.0051 |
0.0047 |
0.0051 |
0.0064 |
0.0075 |
|
Zinc |
30 |
0.003 |
0.005 |
0.005 |
0.005 |
0.004 |
0.005 |
0.009 |
0.012 |
2NHMRC (2008) Guidelines for managing risks in recreational waters (10 x drinking water guideline value, Table 9.3)
| Metal in Water | NHMRC (2008)2 | Samples from the Great Darling Anabranch region (total acid-extractable metals) | |||
|---|---|---|---|---|---|
| Recreational Water Guidelines | 9 | 10 | 11 | 12 | |
| (mg/L) | (mg/L) | (mg/L) | (mg/L) | (mg/L) | |
|
Aluminium |
No value |
3.6 |
0.73 |
4.8 |
4.6 |
|
Arsenic |
0.07 |
0.007 |
0.005 |
0.007 |
0.007 |
|
Chromium |
0.5 |
0.003 |
<0.001 |
0.004 |
0.005 |
|
Cobalt |
No value |
0.0008 |
0.0025 |
0.0012 |
0.0018 |
|
Copper |
20 |
0.0048 |
0.0021 |
0.0049 |
0.0045 |
|
Lead |
0.1 |
0.0006 |
0.007 |
0.0009 |
0.0013 |
|
Nickel |
0.2 |
0.0044 |
0.044 |
0.0050 |
0.0053 |
|
Zinc |
30 |
0.005 |
0.004 |
0.007 |
0.008 |
2NHMRC (2008) Guidelines for managing risks in recreational waters (10 x drinking water guideline value, Table 9.3)
| Metal in Water | NHMRC (2008)2 | Samples from the Lower Darling-Barka River between Weir 32 and Pooncarie (total acid-extractable metals) | ||
|---|---|---|---|---|
| Recreational Water Guidelines | 13 | 14 | 15 | |
| (mg/L) | (mg/L) | (mg/L) | (mg/L) | |
|
Aluminium |
No value |
6.0 |
6.2 |
6.4 |
|
Arsenic |
0.07 |
0.005 |
0.005 |
0.005 |
|
Chromium |
0.5 |
0.006 |
0.006 |
0.006 |
|
Cobalt |
No value |
0.0019 |
0.0021 |
0.0027 |
|
Copper |
20 |
0.0048 |
0.0050 |
0.0056 |
|
Lead |
0.1 |
0.0015 |
0.0015 |
0.0017 |
|
Nickel |
0.2 |
00063 |
0.0067 |
0.0076 |
|
Zinc |
30 |
0.009 |
0.009 |
0.010 |
2NHMRC (2008) Guidelines for managing risks in recreational waters (10 x drinking water guideline value, Table 9.3)
| Metal in Water | ANZG 20183 | Samples from the Menindee Weir Pools in the Darling-Barka River (dissolved metals) | |||||||
|---|---|---|---|---|---|---|---|---|---|
| Water Quality Guideline for aquatic ecosystems (95% species protection) | 1 | 2 | 3 | 4 | 5 | 6 | 7 | 8 | |
| (mg/L) | (mg/L) | (mg/L) | (mg/L) | (mg/L) | (mg/L) | (mg/L) | (mg/L) | (mg/L) | |
|
Aluminium |
0.055 |
<0.04 |
<0.04 |
<0.04 |
<0.04 |
<0.04 |
<0.04 |
<0.04 |
<0.04 |
|
Arsenic |
0.013 |
0.002 |
0.002 |
0.002 |
0.002 |
0.002 |
0.002 |
0.004 |
0.006 |
|
Cadmium |
0.0002 |
<0.0001 |
<0.0001 |
<0.0001 |
<0.0001 |
<0.0001 |
<0.0001 |
<0.0001 |
<0.0001 |
|
Chromium |
0.001 |
<0.001 |
<0.001 |
<0.001 |
<0.001 |
<0.001 |
<0.001 |
<0.001 |
<0.001 |
|
Cobalt |
No value |
0.0002 |
0.0002 |
0.0002 |
0.0002 |
0.0002 |
0.0002 |
0.0002 |
0.0001 |
|
Copper |
0.0014 |
0.0009 |
0.0014 |
0.0013 |
0.0013 |
0.0011 |
0.0012 |
0.0019 | 0.0028 |
|
Lead |
0.0034 |
<0.0001 |
<0.0001 |
<0.0001 |
<0.0001 |
<0.0001 |
<0.0001 |
<0.0001 |
<0.0001 |
|
Manganese |
1.9 |
<0.001 |
<0.001 |
<0.001 |
<0.001 |
<0.001 |
<0.001 |
<0.001 |
<0.001 |
|
Nickel |
0.011 |
0.0027 |
0.0029 |
0.0029 |
0.0028 |
0.0028 |
0.0030 |
0.0027 |
0.0022 |
|
Selenium |
0.005 |
<0.005 |
<0.005 |
<0.005 |
<0.005 |
<0.005 |
<0.005 |
<0.005 |
<0.005 |
|
Silver |
0.0005 |
<0.0001 |
<0.0001 |
<0.0001 |
<0.0001 |
<0.0001 |
<0.0001 |
<0.0001 |
<0.0001 |
|
Zinc |
0.008 |
<0.001 |
<0.001 |
<0.001 |
<0.001 |
<0.001 |
<0.001 |
<0.001 |
<0.001 |
3ANZG (2018). Australian and New Zealand Guidelines for Fresh and Marine Water Quality. Australian and New Zealand Governments and Australian state and territory governments, Canberra ACT, Australia.
| Metal in Water | ANZG 20183 | Samples from the Great Darling Anabranch region (dissolved metals) | |||
|---|---|---|---|---|---|
| Water Quality Guideline for aquatic ecosystems (95% species protection) | 9 | 10 | 11 | 12 | |
| (mg/L) | (mg/L) | (mg/L) | (mg/L) | (mg/L) | |
|
Aluminium |
0.055 |
<0.04 |
<0.04 |
<0.04 |
<0.04 |
|
Arsenic |
0.013 |
0.006 |
0.005 |
0.006 |
0.007 |
|
Cadmium |
0.0002 |
<0.0001 |
<0.0001 |
<0.0001 |
<0.0001 |
|
Chromium |
0.001 |
<0.001 |
<0.001 |
<0.001 |
<0.001 |
|
Cobalt |
No value |
<0.0001 |
0.0013 |
0.0001 |
0.0002 |
|
Copper |
0.0014 |
0.0024 |
0.0010 |
0.0023 | 0.0017 |
|
Lead |
0.0034 |
<0.0001 |
<0.0001 |
<0.0001 |
<0.0001 |
|
Manganese |
1.9 |
<0.001 |
0.001 |
<0.001 |
<0.001 |
|
Nickel |
0.011 |
0.0021 |
0.0025 |
0.0022 |
0.0021 |
|
Selenium |
0.005 |
<0.005 |
<0.005 |
<0.005 |
<0.005 |
|
Silver |
0.0005 |
<0.0001 |
<0.0001 |
<0.0001 |
<0.0001 |
|
Zinc |
0.008 |
<0.001 |
0.001 |
<0.001 |
<0.001 |
3ANZG (2018). Australian and New Zealand Guidelines for Fresh and Marine Water Quality. Australian and New Zealand Governments and Australian state and territory governments, Canberra ACT, Australia.
| Metal in Water | ANZG 20183 | Samples from the Lower Darling-Barka River between Weir 32 and Pooncarie (dissolved metals) | ||
|---|---|---|---|---|
| Water Quality Guideline for aquatic ecosystems (95% species protection) | 13 | 14 | 15 | |
| (mg/L) | (mg/L) | (mg/L) | (mg/L) | |
|
Aluminium |
0.055 |
<0.04 |
<0.04 |
<0.04 |
|
Arsenic |
0.013 |
0.004 |
0.004 |
0.004 |
|
Cadmium |
0.0002 |
<0.0001 |
<0.0001 |
<0.0001 |
|
Chromium |
0.001 |
<0.001 |
<0.001 |
<0.001 |
|
Cobalt |
No value |
0.0002 |
0.0002 |
0.0003 |
|
Copper |
0.0014 |
0.0019 | 0.0019 | 0.0020 |
|
Lead |
0.0034 |
<0.0001 |
<0.0001 |
<0.0001 |
|
Manganese |
1.9 |
<0.001 |
<0.001 |
<0.001 |
|
Nickel |
0.011 |
0.0026 |
0.0030 |
0.0031 |
|
Selenium |
0.005 |
<0.005 |
<0.005 |
<0.005 |
|
Silver |
0.0005 |
<0.0001 |
<0.0001 |
<0.0001 |
|
Zinc |
0.008 |
<0.001 |
<0.001 |
<0.001 |
3ANZG (2018). Australian and New Zealand Guidelines for Fresh and Marine Water Quality. Australian and New Zealand Governments and Australian state and territory governments, Canberra ACT, Australia.
References
ANZG (2018), Australian and New Zealand Guidelines for Fresh and Marine Water Quality, Australian and New Zealand Governments and Australian state and territory governments, Canberra ACT, Australia. Available at www.waterquality.gov.au/anz-guidelines
Basin Plan (2012), Schedule 11, Water Act 2007, Murray-Darling Basin Authority, Commonwealth of Australia
NHMRC (2008), Guidelines for managing risks in recreational waters, Australian Government National Health and Medical Research Council
Download the full test results
30 April results
- Report for metals and pesticides – 30 April, Menindee weir pools (PDF 1.5MB)
- Report for algal toxins – 30 April, Menindee weir pools (PDF 180KB)
- Report for algal identification and cell count – 30 April, Menindee weir pools (PDF 206KB)
- Report for nutrients, glyphosate, phenoxyherbicides – 30 April, Menindee weir pools (PDF 695KB)
1 May results
- Report for metals and pesticides – 1 May, Great Darling Anabranch and Lower Darling-Barka River (PDF 1MB)
- Report for algal toxins – 1 May, Great Darling Anabranch and Lower Darling-Barka River (PDF 161KB)
- Report for algal identification and cell count – 1 May, Great Darling Anabranch and Lower Darling-Barka River (PDF 202KB)
- Report for nutrients, glyphosate, phenoxyherbicides – 1 May, Great Darling Anabranch and Lower Darling-Barka River (PDF 692KB)
The EPA and Department of Planning and Environment (DPE) collected seventeen water samples between 26 and 29 April 2023 at Menindee along the Darling-Barka River, downstream along the lower Darling-Barka River, and along the Great Darling Anabranch.
Samples were checked for pesticides, excess nitrogen and phosphorus, ammonia, metals, algae and algal toxins.
The concentrations of the bacterial indicator, enterococci, in samples collected on 24 April 2023 were below guideline values for recreational use (NHMRC 2008). The EPA is no longer testing for bacteria due to difficulties meeting laboratory holding times for accurate measurement. The holding time is the time allowed from sample collection until analysis, and varies depending on the test. The holding time for bacteria testing is 24 hours.
Summary
Pesticides
Samples were scanned for more than 600 pesticides. None were detected.
Nitrogen and phosphorus
Nitrogen and phosphorous levels are high. If nitrogen and phosphorus stay high they can cause algal blooms.
Algae and algal toxins
Potentially toxic blue-green algae was detected in all but one sample from the Menindee region. The algal toxin Cylindrospermopsin was detected in all but two samples from the Menindee region.
A ‘red alert’ is in place along parts of the lower Darling-Barka River. An ‘amber alert’ is in place along the Great Darling Anabranch and along the Darling-Barka River, at Menindee and further downstream, as of 20 June 2023. See WaterNSW for information about red alerts
Metals
Copper was slightly above the level set to protect water life in some samples across all 3 regions (primarily along the lower Darling-Barka), but well below the level harmful to fish. All other metals were under the levels set to protect water life.
Sample locations
Water was sampled between 26 and 29 April 2023 from seventeen locations on the Darling-Barka River at Menindee, downstream along the lower Darling-Barka River to Pooncarie, and along the Great Darling Anabranch.
On 26 April 2023, eight samples were collected from the Menindee Weir Pools along the Darling-Barka River. The correlating sample identifications are given in brackets for reference to the full laboratory report data.
- Sample 1 (B1) – Lake Wetherell upstream of the Main Weir
- Sample 2 (B2) – Outlet of Lake Pamamaroo into Darling River
- Sample 3 (E1) – Upper weir pool
- Sample 4 (E2) – Mid weir pool
- Sample 5 (E3) – Menindee rail bridge
- Sample 6 (E4) – Downstream Menindee town
- Sample 7 (E5) – Lower weir pool downstream Lake Menindee inflow
- Sample 8 (B3) – Outlet of Lake Menindee into Darling-Barka River
On 27 April 2023, three samples were collected from the Great Darling Anabranch region.
- Sample 9 (B4) – Lake Cawndilla outlet into the anabranch of Darling River
- Sample 10 (E6) – Redbank Creek upstream of Cawndilla Channel confluence
- Sample 12 (E7) – Tandou Creek at Packers Crossing (incorporating inflows from Packers Lake)
On 28 April 2023, three samples were collected from the lower Darling-Barka River between Weir 32 and Pooncarie.
- Sample 13 (E8) – Kinchega National Park upper
- Sample 14 (E9) – Kinchega National Park mid (incorporating inflows from Emu Lake)
- Sample 16 (E11) – Bindara Station reach
On 29 April 2023, three samples were collected from the lower Darling-Barka River between Weir 32 and Pooncarie.
- Sample 18 (E13) – Coona Point reach
- Sample 19 (E14) – Mullingar Station reach
- Sample 20 (E15) – Old wharf at Pooncarie
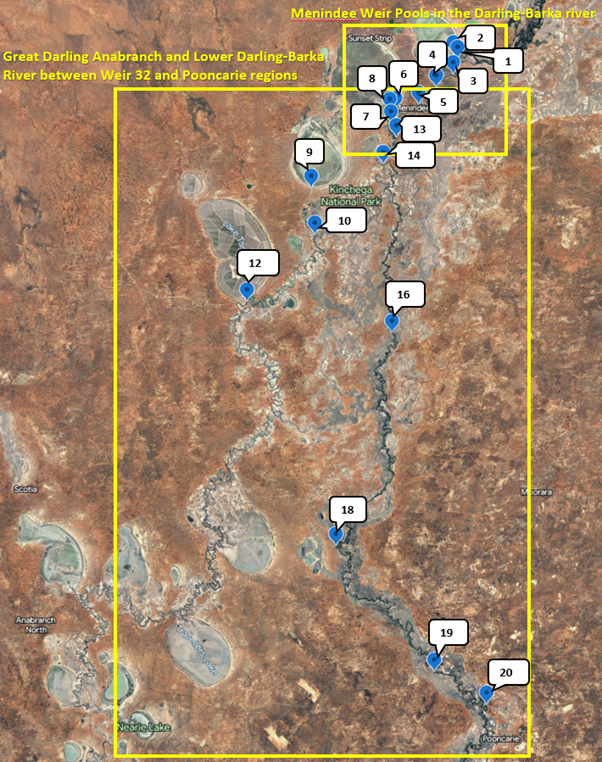
Figure 1: Sample locations where samples were taken between 26 to 29 April 2023. See Figures 2 and 3 below for more detail.
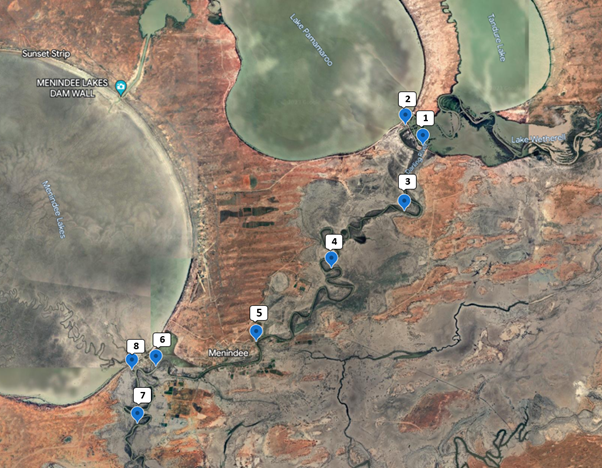
Figure 2: Sample locations for the Menindee Weir Pools region along the Darling-Barka River
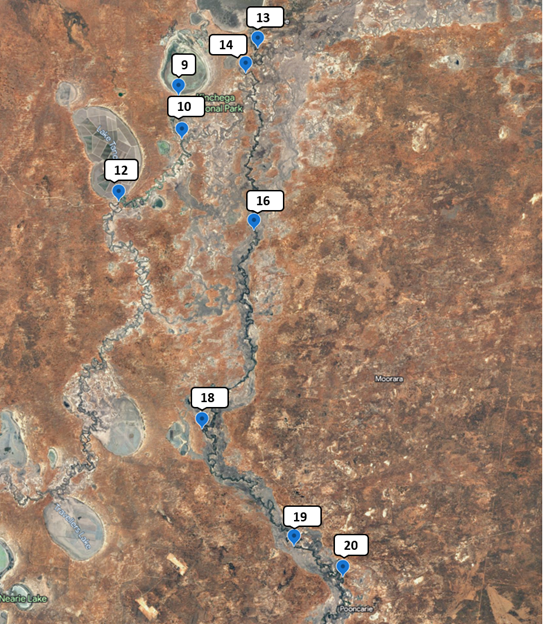
Figure 3: Sample locations for the Great Darling Anabranch and lower Darling-Barka river between Weir 32 and Pooncarie regions
More sampling
The DPE and EPA are conducting regular water quality monitoring at Menindee along the Darling-Barka River, downstream along the lower Darling-Barka River, and along the Great Darling Anabranch. The test results from these samples will also be published on this website.
In-field measurements
At the time of sampling, the EPA collected in-field measurements for pH, dissolved oxygen, conductivity, temperature and turbidity.
Sample 10, collected from the Great Darling Anabranch region at Redbank Creek, was saturated with oxygen and had very high nutrient load. When water holds as much dissolved oxygen as it can at a specific temperature, it is said to be saturated with oxygen. The oxygen saturation and nutrient load is likely due to a cyanobacteria bloom at the time. The sample location is adjacent to a complex wetland system and is prone to high variability in water quality. All other parameters are within the expected ranges.
| Sample | Location |
Temp (°C) |
Dissolved oxygen (mg/L) | Electrical conductivity (µS/cm) | pH | Turbidity (NTU) |
|---|---|---|---|---|---|---|
|
1 (B1) |
Lake Wetherell upstream of the Main Weir |
21.2 |
9.5 |
564 |
8.7 |
15.9 |
|
2 (B2) |
Outlet of Lake Pamamaroo into Darling River |
19.7 |
7.5 |
538 |
8.3 |
26.4 |
|
3 (E1) |
Upper weir pool |
19.8 |
7.5 |
538 |
8.2 |
26.3 |
|
4 (E2) |
Mid weir pool |
19.8 |
9.1 |
517 |
8.4 |
26.6 |
|
5 (E3) |
Menindee rail bridge |
19.4 |
7.8 |
502 |
8.3 |
27.1 |
|
6 (E4) |
Downstream Menindee town |
18.9 |
6.4 |
508 |
8.0 |
28.8 |
|
7 (E5) |
Lower weir pool downstream Lake Menindee inflow |
18.9 |
6.6 |
446 |
8.0 |
57.5 |
|
8 (B3) |
Outlet of Lake Menindee into Darling-Barka River |
18.8 |
9.3 |
363 |
8.3 |
83.2 |
|
9 (B4) |
Lake Cawndilla outlet into the anabranch of Darling River |
18.4 |
9.3 |
390 |
8.6 |
44.8 |
|
10 (E6) |
Redbank Creek upstream of Cawndilla Channel confluence |
21.3 |
16.4 |
463 |
9.5 |
40.6 |
|
12 (E7) |
Tandou Creek at Packers Crossing (incorporating inflows from Packers Lake) |
19.4 |
7.1 |
427 |
8.6 |
61.5 |
|
13 (E8) |
Kinchega National Park upper |
18.7 |
7.1 |
450 |
7.9 |
76.5 |
|
14 (E9) |
Kinchega National Park mid (incorporating inflows from Emu Lake) |
18.7 |
6.7 |
442 |
8.0 |
71.9 |
|
16 (E11) |
Bindara Station reach |
19.0 |
5.9 |
455 |
7.8 |
78.8 |
|
18 (E13) |
Coona Point reach |
18.6 |
6.2 |
436 |
7.8 |
85.6 |
|
19 (E14) |
Mullingar Station reach |
18.6 |
6.3 |
451 |
7.8 |
83.3 |
|
20 (E15) |
Old wharf at Pooncarie |
18.3 |
5.9 |
445 |
7.8 |
94.9 |
Nitrogen, phosphorus and ammonia
Sample results show that total nitrogen and total phosphorous are higher than the acceptable levels given for lowland river ecosystems in NSW (ANZG 2018, which are in agreement with the regionally specific set of guideline values for the Murray-Darling outlined in the Basin Plan 2012). Total nitrogen was detected at typically up to four times higher than the guideline value, except for sample 10 at Redbank Creek, which was 11 times higher. Total phosphorous was detected at eleven times higher than the guideline value. Algal blooms are possible if these nutrients remain elevated.
Bacteria convert nitrogen compounds such as ammonia into nitrite and nitrate. These compounds can harm aquatic organisms. Ammonia was well below the Australian and New Zealand water quality guidelines for toxicity. While the levels would not be expected to be harmful to fish, the ammonia could promote growth in algae and macrophytes. The ammonia is likely to be from river sources including rotting fish and flood organic matter rather than diffuse inputs from surrounding land.
Algae and algal toxins
A wide variety of algae was tested for. Blue-green algae was detected in all samples. The algal toxin Cylindrospermopsin was detected in all samples except sample 8 at the Outlet of Lake Menindee into Darling-Barka River and sample 9 at Lake Cawndilla outlet into the Anabranch of Darling River.
The algae levels detected fall within the ‘amber’ to ‘red’ alert levels. A ‘red alert’ is in place along parts of the lower Darling-Barka River. An ‘amber alert’ is in place along the Great Darling Anabranch and along the Darling-Barka River, at Menindee and further downstream, as of 20 June 2023.
Pesticides
As noted above, a pesticide screening test that scanned for over 600 pesticides was completed for samples from all seventeen locations. All samples came back negative for pesticide detection.
Metals
Many metals are vital for humans and animals to stay healthy and only pose a risk if they are found at high levels in the environment. Concentrations of key metals found in water are below.
Total metals have been compared to recreational water quality guidelines and dissolved metals have been compared to ecological water quality guidelines as per the National Health and Medical Research Council (NHMRC) recreational and Australian and New Zealand Water Quality (ANZG) guidelines, respectively.
Total metals provide a more conservative estimate of exposure from recreational use whereas dissolved metals are used for ecological assessments as this is the bioavailable fraction of the metal (the part that is toxic to organisms).
| Metal in Water | NHMRC (2008)2 | Samples from the Menindee Weir Pools along the Darling-Barka River (total acid-extractable metals) | |||||||
|---|---|---|---|---|---|---|---|---|---|
| Recreational Water Guidelines | 1 | 2 | 3 | 4 | 5 | 6 | 7 | 8 | |
| (mg/L) | (mg/L) | (mg/L) | (mg/L) | (mg/L) | (mg/L) | (mg/L) | (mg/L) | (mg/L) | |
|
Aluminium |
No value |
0.52 |
1.6 |
1.3 |
1.3 |
1.1 |
1.3 |
2.8 |
4.4 |
|
Arsenic |
0.07 |
0.002 |
0.003 |
0.003 |
0.003 |
0.003 |
0.003 |
0.004 |
0.006 |
|
Chromium |
0.5 |
<0.001 |
0.002 |
0.002 |
0.002 |
0.001 |
0.002 |
0.003 |
0.005 |
|
Cobalt |
No value |
0.0012 |
0.0015 |
0.0014 |
0.0014 |
0.0012 |
0.0014 |
0.0016 |
0.0017 |
|
Copper |
20 |
0.0021 |
0.0026 |
0.0025 |
0.0026 |
0.0025 |
0.0025 |
0.0039 |
0.0091 |
|
Lead |
0.1 |
0.0005 |
0.0009 |
0.0008 |
0.0012 |
0.0007 |
0.0010 |
0.0011 |
0.0015 |
|
Nickel |
0.2 |
0.0036 |
0.0046 |
0.0044 |
0.0043 |
0.0042 |
0.0044 |
0.0053 |
0.0061 |
|
Zinc |
30 |
0.003 |
0.005 |
0.004 |
0.004 |
0.008 |
0.005 |
0.007 |
0.009 |
2NHMRC (2008) Guidelines for managing risks in recreational waters (10 x drinking water guideline value, Table 9.3)
| Metal in Water | NHMRC (2008)2 | Samples from the Great Darling Anabranch region (total acid-extractable metals) | ||
|---|---|---|---|---|
| Recreational Water Guidelines | 9 | 10 | 12 | |
| (mg/L) | (mg/L) | (mg/L) | (mg/L) | |
|
Aluminium |
No value |
3.1 |
1.3 |
3.0 |
|
Arsenic |
0.07 |
0.006 |
0.005 |
0.007 |
|
Chromium |
0.5 |
0.004 |
0.002 |
0.003 |
|
Cobalt |
No value |
0.0012 |
0.0030 |
0.0019 |
|
Copper |
20 |
0.0054 |
0.0025 |
0.0065 |
|
Lead |
0.1 |
0.0012 |
0.0013 |
0.0014 |
|
Nickel |
0.2 |
0.0050 |
0.0051 |
0.0050 |
|
Zinc |
30 |
0.007 |
0.006 |
0.009 |
2NHMRC (2008) Guidelines for managing risks in recreational waters (10 x drinking water guideline value, Table 9.3)
| Metal in Water | NHMRC (2008)2 | Samples from the lower Darling-Barka River between Weir 32 and Pooncarie (total acid-extractable metals) | ||||||
|---|---|---|---|---|---|---|---|---|
| Recreational Water Guidelines | 13 | 14 | 16 | 18 | 19 | 20 | ||
| (mg/L) | (mg/L) | (mg/L) | (mg/L) | (mg/L) | (mg/L) | (mg/L) | ||
|
Aluminium |
No value |
3.0 |
3.3 |
3.5 |
6.8 |
6.4 |
7.7 |
|
|
Arsenic |
0.07 |
0.004 |
0.005 |
0.005 |
0.006 |
0.005 |
0.005 |
|
|
Chromium |
0.5 |
0.004 |
0.004 |
0.004 |
0.007 |
0.007 |
0.008 |
|
|
Cobalt |
No value |
0.0017 |
0.0021 |
0.0023 |
0.0028 |
0.0029 |
0.0032 |
|
|
Copper |
20 |
0.0043 |
0.0046 |
0.0047 |
0.0390 |
0.0056 |
0.0060 |
|
|
Lead |
0.1 |
0.0017 |
0.0015 |
0.0015 |
0.0020 |
0.0022 |
0.0023 |
|
|
Nickel |
0.2 |
0.0055 |
0.0059 |
0.0063 |
0.0080 |
0.0079 |
0.0086 |
|
|
Zinc |
30 |
0.007 |
0.008 |
0.008 |
0.011 |
0.012 |
0.013 |
|
2NHMRC (2008) Guidelines for managing risks in recreational waters (10 x drinking water guideline value, Table 9.3)
|
Metal in Water
|
ANZG 20183 | Samples from the Menindee Weir Pools along the Darling-Barka River (dissolved metals) | |||||||
|---|---|---|---|---|---|---|---|---|---|
| Water Quality Guideline for aquatic ecosystems (95% species protection) |
1 |
2 |
3 |
4 |
5 |
6 |
7 |
8 |
|
| (mg/L) |
(mg/L) |
(mg/L) |
(mg/L) |
(mg/L) |
(mg/L) |
(mg/L) |
(mg/L) |
(mg/L) |
|
|
Aluminium |
0.055 |
<0.04 |
<0.04 |
<0.04 |
<0.04 |
<0.04 |
<0.04 |
<0.04 |
<0.04 |
|
Arsenic |
0.013 |
0.002 |
0.002 |
0.002 |
0.002 |
0.002 |
0.002 |
0.004 |
0.006 |
|
Cadmium |
0.0002 |
<0.0001 |
<0.0001 |
<0.0001 |
<0.0001 |
<0.0001 |
<0.0001 |
<0.0001 |
<0.0001 |
|
Chromium |
0.001 |
<0.001 |
<0.001 |
<0.001 |
<0.001 |
<0.001 |
<0.001 |
<0.001 |
<0.001 |
|
Cobalt |
No value |
0.0002 |
0.0002 |
0.0002 |
0.0002 |
0.0002 |
0.0002 |
0.0002 |
0.0001 |
|
Copper |
0.0014 |
0.0011 |
0.0012 |
0.0013 |
0.0013 |
0.0013 |
0.0011 |
0.0018 | 0.0028 |
|
Lead |
0.0034 |
<0.0001 |
<0.0001 |
<0.0001 |
<0.0001 |
<0.0001 |
<0.0001 |
<0.0001 |
<0.0001 |
|
Manganese |
1.9 |
<0.001 |
<0.001 |
<0.001 |
<0.001 |
<0.001 |
<0.001 |
<0.001 |
<0.001 |
|
Nickel |
0.011 |
0.0025 |
0.0029 |
0.0028 |
0.0031 |
0.0030 |
0.0030 |
0.0027 |
0.0022 |
|
Selenium |
0.005 |
<0.005 |
<0.005 |
<0.005 |
<0.005 |
<0.005 |
<0.005 |
<0.005 |
<0.005 |
|
Silver |
0.0005 |
<0.0001 |
<0.0001 |
<0.0001 |
<0.0001 |
<0.0001 |
<0.0001 |
<0.0001 |
<0.0001 |
|
Zinc |
0.008 |
<0.001 |
<0.001 |
<0.001 |
<0.001 |
<0.001 |
<0.001 |
<0.001 |
<0.001 |
3ANZG (2018). Australian and New Zealand Guidelines for Fresh and Marine Water Quality. Australian and New Zealand Governments and Australian state and territory governments, Canberra ACT, Australia.
|
Metal in Water
|
ANZG 20183 | Samples from the Great Darling Anabranch region (dissolved metals) | ||
|---|---|---|---|---|
| Water Quality Guideline for aquatic ecosystems (95% species protection) |
9 |
10 |
12 |
|
| (mg/L) |
(mg/L) |
(mg/L) |
(mg/L) |
|
|
Aluminium |
0.055 |
<0.04 |
<0.04 |
<0.04 |
|
Arsenic |
0.013 |
0.006 |
0.005 |
0.007 |
|
Cadmium |
0.0002 |
<0.0001 |
<0.0001 |
<0.0001 |
|
Chromium |
0.001 |
<0.001 |
<0.001 |
<0.001 |
|
Cobalt |
No value |
<0.0001 |
0.0014 |
0.0003 |
|
Copper |
0.0014 |
0.0027 |
0.0010 |
0.0017 |
|
Lead |
0.0034 |
<0.0001 |
<0.0001 |
<0.0001 |
|
Manganese |
1.9 |
<0.001 |
<0.001 |
<0.001 |
|
Nickel |
0.011 |
0.0023 |
0.0027 |
0.0022 |
|
Selenium |
0.005 |
<0.005 |
<0.005 |
<0.005 |
|
Silver |
0.0005 |
<0.0001 |
<0.0001 |
<0.0001 |
|
Zinc |
0.008 |
<0.001 |
<0.001 |
<0.001 |
3ANZG (2018). Australian and New Zealand Guidelines for Fresh and Marine Water Quality. Australian and New Zealand Governments and Australian state and territory governments, Canberra ACT, Australia.
|
Metal in Water
|
ANZG 20183 | Samples from the lower Darling-Barka River between Weir 32 and Pooncarie (dissolved metals) | ||||||
|---|---|---|---|---|---|---|---|---|
| Water Quality Guideline for aquatic ecosystems (95% species protection) |
13 |
14 |
16 |
18 |
19 |
20 |
||
| (mg/L) |
(mg/L) |
(mg/L) |
(mg/L) |
(mg/L) |
(mg/L) |
(mg/L) |
||
|
Aluminium |
0.055 |
<0.04 |
<0.04 |
<0.04 |
<0.04 |
<0.04 |
<0.04 |
|
|
Arsenic |
0.013 |
0.004 |
0.004 |
0.004 |
0.004 |
0.004 |
0.004 |
|
|
Cadmium |
0.0002 |
<0.0001 |
<0.0001 |
<0.0001 |
<0.0001 |
<0.0001 |
<0.0001 |
|
|
Chromium |
0.001 |
<0.001 |
<0.001 |
<0.001 |
<0.001 |
<0.001 |
<0.001 |
|
|
Cobalt |
No value |
0.0002 |
0.0002 |
0.0003 |
0.0003 |
0.0003 |
0.0003 |
|
|
Copper |
0.0014 |
0.0018 | 0.0019 | 0.0018 | 0.0019 | 0.0018 | 0.0017 | |
|
Lead |
0.0034 |
<0.0001 |
<0.0001 |
<0.0001 |
<0.0001 |
<0.0001 |
<0.0001 |
|
|
Manganese |
1.9 |
<0.001 |
<0.001 |
<0.001 |
<0.001 |
<0.001 |
<0.001 |
|
|
Nickel |
0.011 |
0.0029 |
0.0028 |
0.0031 |
0.0033 |
0.0032 |
0.0031 |
|
|
Selenium |
0.005 |
<0.005 |
<0.005 |
<0.005 |
<0.005 |
<0.005 |
<0.005 |
|
|
Silver |
0.0005 |
<0.0001 |
<0.0001 |
<0.0001 |
<0.0001 |
<0.0001 |
<0.0001 |
|
|
Zinc |
0.008 |
<0.001 |
<0.001 |
<0.001 |
<0.001 |
<0.001 |
<0.001 |
|
3ANZG (2018). Australian and New Zealand Guidelines for Fresh and Marine Water Quality. Australian and New Zealand Governments and Australian state and territory governments, Canberra ACT, Australia.
References
ANZG (2018), Australian and New Zealand Guidelines for Fresh and Marine Water Quality, Australian and New Zealand Governments and Australian state and territory governments, Canberra ACT, Australia. Available at www.waterquality.gov.au/anz-guidelines
Basin Plan (2012), Schedule 11, Water Act 2007, Murray-Darling Basin Authority, Commonwealth of Australia
NHMRC (2008), Guidelines for managing risks in recreational waters, Australian Government National Health and Medical Research Council
Download the full test results
26 April results
- Report for metals and pesticides – 26 April, Menindee (PDF 1.5MB)
- Report for algal toxins – 26 April, Menindee (PDF 180KB)
- Report for algal identification and cell count – 26 April, Menindee (PDF 206KB)
- Report for nutrients – 26 April, Menindee (PDF 695KB)
27 April results
- Report for metals and pesticides – 27 April, Great Darling Anabranch (PDF 1MB)
- Report for algal toxins – 27 April, Great Darling Anabranch (PDF 161KB)
- Report for algal identification and cell count – 27 April, Great Darling Anabranch (PDF 202KB)
- Report for nutrients – 27 April, Great Darling Anabranch (PDF 692KB)
28 April results
- Report for metals and pesticides – 28 April, Pooncarie (PDF 1MB)
- Report for algal toxins – 28 April, Pooncarie (PDF 223KB)
- Report for algal identification and cell count – 28 April, Pooncarie (PDF 203KB)
- Report for nutrients – 28 April, Pooncarie (PDF 692KB)
29 April results
The NSW Environment Protection Authority (EPA) collected three water samples on 24 April 2023 at Menindee along the Darling-Barka River.
Samples were checked for pesticides, excess nitrogen and phosphorus, ammonia, metals, bacteria, algae and algal toxins.
Summary
Pesticides
Samples were scanned for more than 600 pesticides. None were detected.
Nitrogen and phosphorus
Nitrogen and phosphorous levels are high. If nitrogen and phosphorus stay high they can cause algal blooms.
Algae and algal toxins
Algae, including blue-green algae, and the algal toxin Cylindrospermopsin was detected in all three samples collected from the Darling-Barka River at Menindee.
An ‘amber alert’ is in place in the Darling-Barka River at Menindee as of 10 May 2023.
Information about algae alerts is available at https://www.waternsw.com.au/water-services/water-quality/algae-alerts
Metals
All metals in the Darling-Barka River samples were under the levels set to protect water life.
Bacterial
The concentrations of the bacterial indicator, enterococci, are below guideline values for recreational use (NHMRC 2008).
Sample locations
Water was sampled on 24 April 2023 from three locations on the Darling-Barka River at Menindee.
- Sample 1 – approximately 840m NE of Menindee Golf Club
- Sample 2 – end of Maiden St
- Sample 3 – beneath Menindee St bridge
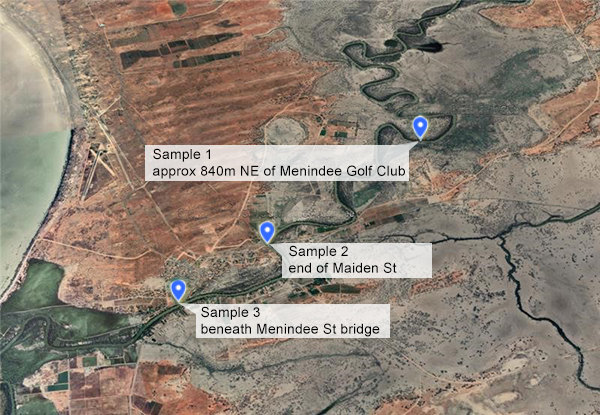
More sampling
The EPA is conducting regular water quality monitoring on the Darling-Barka River from upstream of Menindee to Pooncarie as well as the Great Darling Anabranch. The test results from these samples will also be published on this website.
In-field measurements
At the time of sampling, the EPA collected in-field measurements for pH, dissolved oxygen, conductivity, temperature and turbidity.
All parameters are within the expected ranges.
| Sample name | Location | Temp (°C) | Dissolved oxygen (mg/L) | Electrical conductivity (µS/cm) | pH | Turbidity (NTU) |
|---|---|---|---|---|---|---|
|
1 |
approximately 840m NE of Menindee Golf Club |
19.0 |
8.0 |
504 |
8.2 |
158 |
|
2 |
End of Maiden St |
19.0 |
6.6 |
506 |
8.1 |
154 |
|
3 |
Beneath Menindee St bridge |
19.0 |
5.9 |
510 |
8.0 |
167 |
Nitrogen, phosphorus and ammonia
Sample results show that total nitrogen and total phosphorous are higher than the acceptable levels given for lowland river ecosystems in NSW (ANZG 2018, which are in agreement with the regionally specific set of guideline values for the Murray-Darling outlined in the Basin Plan 2012). Total nitrogen was detected at three times higher than the guideline value while total phosphorous was detected at four times higher. Algal blooms are possible if these nutrients remain elevated.
Bacteria convert nitrogen compounds such as ammonia into nitrite and nitrate. These compounds can harm aquatic organisms. Ammonia was well below the Australian and New Zealand water quality guidelines for toxicity. While the levels would not be expected to be harmful to fish, the ammonia could promote growth in algae and macrophytes. The ammonia is likely to be from river sources including rotting fish and flood organic matter rather than diffuse inputs from surrounding land.
Algae and algal toxins
A wide variety of algae was tested for. There were positive detections in all samples for a range of algal species, including blue-green algae. The algal toxin Cylindrospermopsin was detected in all samples.
The algae levels detected fall within the ‘amber’ alert levels. An ‘amber alert’ is in place in the Darling Barka River at Menindee as of 10 May 2023.
Pesticides
As noted above, a pesticide screening test that scanned for over 600 pesticides was completed for samples from all three locations. All samples came back negative for pesticide detection.
Metals
Many metals are vital for humans and animals to stay healthy and only pose a risk if they are found at high levels in the environment. Concentrations of key metals found in water are below.
Total metals have been compared to recreational water quality guidelines and dissolved metals have been compared to ecological water quality guidelines as per the National Health and Medical Research Council (NHMRC) recreational and Australian and New Zealand Water Quality (ANZG) guidelines, respectively.
Total metals provide a more conservative estimate of exposure from recreational use whereas dissolved metals are used for ecological assessments as this is the bioavailable fraction of the metal (the part that is toxic to organisms).
| Metal in Water | NHMRC (2008)2 | Sample (total acid-extractable metals) | ||
|---|---|---|---|---|
| Recreational Water Guidelines | Sample 1 | Sample 2 | Sample 3 | |
| (mg/L) | (mg/L) | (mg/L) | (mg/L) | |
|
Aluminium |
No value |
2.7 |
2.6 |
3.8 |
|
Arsenic |
0.07 |
0.003 |
0.003 |
0.003 |
|
Chromium |
0.5 |
0.003 |
0.003 |
0.004 |
|
Cobalt |
No value |
0.0016 |
0.0017 |
0.0020 |
|
Copper |
20 |
0.0029 |
0.0029 |
0.0033 |
|
Lead |
0.1 |
0.0010 |
0.0013 |
0.0014 |
|
Nickel |
0.2 |
0.0048 |
0.0049 |
0.0055 |
|
Zinc |
30 |
0.005 |
0.005 |
0.006 |
2NHMRC (2008) Guidelines for managing risks in recreational waters (10 x drinking water guideline value, Table 9.3)
| Metal in Water | ANZG 20183 | Sample (dissolved metals) | ||
|---|---|---|---|---|
| Water Quality Guideline for aquatic ecosystems (95% species protection) | Sample 1 | Sample 2 | Sample 3 | |
| (mg/L) | (mg/L) | (mg/L) | (mg/L) | |
|
Aluminium |
0.055 |
<0.04 |
<0.04 |
<0.04 |
|
Arsenic |
0.013 |
0.002 |
0.002 |
0.002 |
|
Cadmium |
0.0002 |
<0.0001 |
<0.0001 |
<0.0001 |
|
Chromium |
0.001 |
<0.001 |
<0.001 |
<0.001 |
|
Cobalt |
No value |
0.0003 |
0.0002 |
0.0002 |
|
Copper |
0.0014 |
0.0014 |
0.0013 |
0.0010 |
|
Lead |
0.0034 |
<0.0001 |
<0.0001 |
<0.0001 |
|
Manganese |
1.9 |
<0.001 |
<0.001 |
<0.001 |
|
Nickel |
0.011 |
0.0031 |
0.0031 |
0.0028 |
|
Selenium |
0.005 |
<0.005 |
<0.005 |
<0.005 |
|
Silver |
0.0005 |
<0.0001 |
<0.0001 |
<0.0001 |
|
Zinc |
0.008 |
<0.001 |
<0.001 |
<0.001 |
3ANZG (2018). Australian and New Zealand Guidelines for Fresh and Marine Water Quality. Australian and New Zealand Governments and Australian state and territory governments, Canberra ACT, Australia.
References
ANZG (2018), Australian and New Zealand Guidelines for Fresh and Marine Water Quality, Australian and New Zealand Governments and Australian state and territory governments, Canberra ACT, Australia. Available at www.waterquality.gov.au/anz-guidelines
Basin Plan (2012), Schedule 11, Water Act 2007, Murray-Darling Basin Authority, Commonwealth of Australia
NHMRC (2008), Guidelines for managing risks in recreational waters, Australian Government National Health and Medical Research Council
NSW Department of Primary Industries (DPI) Fisheries collected 5 samples of golden perch (Macquaria ambigua) from the Darling-Barka River at Pooncarie on 28 March.
The gastrointestinal tract and gills of the fish were analysed for metals and pesticides. The gastrointestinal tract can show what chemicals have been ingested by the fish and the gills give an indication of overall exposure from the surrounding water.
Pesticides
Samples were scanned for more than 600 pesticides. None were detected.
Metals
Many metals are vital for humans and animals to stay healthy and only pose a risk if they are found at high levels in the environment.
The only metals found in the gastrointestinal tract of the fish were zinc and mercury. These metals are known to bioaccumulate in fish. No gastrointestinal tract data are available as background in NSW, but these concentrations are below concentrations reported internationally.
Zinc and mercury were also found in the gills of the fish. This indicates some recent exposure to these metals from the water. However, water concentrations were all below water quality guidelines indicating these metals will not have adversely impacted the health of the fish.
| Heavy Metal | Reported mean concentration (mg/kg) in international literature for gastrointestinal tract | Reported mean concentration (mg/kg) in international literature for gills | Concentration in the gastrointestinal tract (mg/kg) | Concentration in gills (mg/kg) |
|---|---|---|---|---|
|
Mercury |
0.02-3.6 (12 fish species with varying food regimes)1 |
0.007 - 0.03 (perch)2 |
0.044-0.055 |
0.023-0.036 |
|
Zinc |
11-559 (pike and bream)3 |
12-171 (pike and bream)3 |
10-15 |
21-28 |
1Regine 2006 2 Luczynska 2016 3 Rajkowska 2013
Download the full test reports: 28 March
The full report (with individual's names and addresses redacted for privacy) are available for download
Sample locations
Fish samples were collected from two locations near Pooncarie on 28 March 2023.
- Sample 1 – Downstream of Pooncarie Weir
- Sample 2 – Pooncarie Cafe
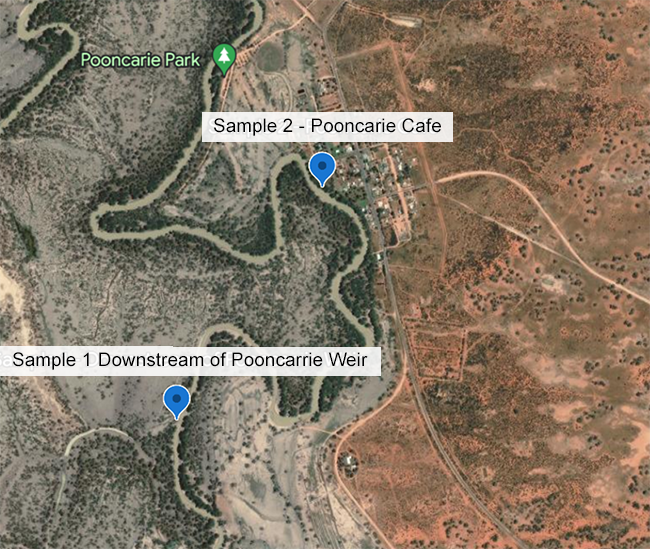
References
FSANZ. 2001. Generally expected levels (GELs) for Metal Contaminants - Additional guidelines to maximum levels in Standard 1.4..1 - Contaminants and Natural Toxicants. Australian New Zealand Food Standards Code.
1Regine M.B., Gilles D., Yannick D. and Alain B. (2006). Mercury distribution in fish organs and food regimes: Significant relationships from twelve species collected in French Guiana (Amazonian basin). Science of the Total Environment. 368: 262-270
2Luczynska J., Luczynski M. J. and Paszczyk B. (2016). Assessment of mercury in muscles, liver and gills of marine and freshwater fish. Journal of Elementology. 21(1): 113-129
3Rajkowska M. and Protasowicki M. (2013). Distribution of metals (Fe, Mn, Zn, Cu) in fish tissues in two lakes of different trophy in Northwestern Poland. Environmental Monitoring and Assessment. 185(4): 3493-3502
WaterNSW collected six water samples for the EPA on 11 April 2023 downstream of Menindee on the Darling-Barka River, the Murray River and the Great Darling Anabranch.
Samples were checked for pesticides, excess nitrogen and phosphorus, ammonia, metals, bacteria, algae and algal toxins.
Summary
Pesticides
Samples were scanned for more than 600 pesticides. None were detected.
Nitrogen and phosphorus
Nitrogen and phosphorous levels are high. If nitrogen and phosphorus stay high they can cause algal blooms.
Algae and algal toxins
Algae, including blue-green algae, were detected in all six samples. A ‘red alert’ is in place in the Murray River at Fort Courage and in the Great Darling Anabranch at Silver City Highway as of 28 April 2023. The algal toxin Cylindrospermopsin was detected in samples collected from the Murray River in these locations.
An ‘amber alert’ is in place in the Murray River at Merbein and in the Darling-Barka River at Merbein, Ellerslie and Burtundy.
Information about algae alerts is available at https://www.waternsw.com.au/water-services/water-quality/algae-alerts
Metals
Copper remains slightly above the level set to protect water life but well below the level harmful to fish. All other metals were under the levels set to protect water life.
Bacterial
The concentration of the bacterial indicator, enterococci, exceeded guideline values for recreational use (NHMRC 2008) at two sites in the Murray River at Fort Courage and in the Darling-Barka River at Ellerslie.
Sample locations
Water was sampled on 11 April 2023 from six locations downstream of Menindee on the Darling-Barka River, the Murray River and the Great Darling Anabranch:
- Sample 1 – Murray River at Merbein Pump Station
- Sample 2 – Darling-Barka River at Tapio
- Sample 3 – Darling-Barka River at Ellerslie
- Sample 4 – Darling-Barka River at Burtundy
- Sample 5 – Great Darling Anabranch at Silver City Highway
- Sample 6 – Murray River at Fort Courage
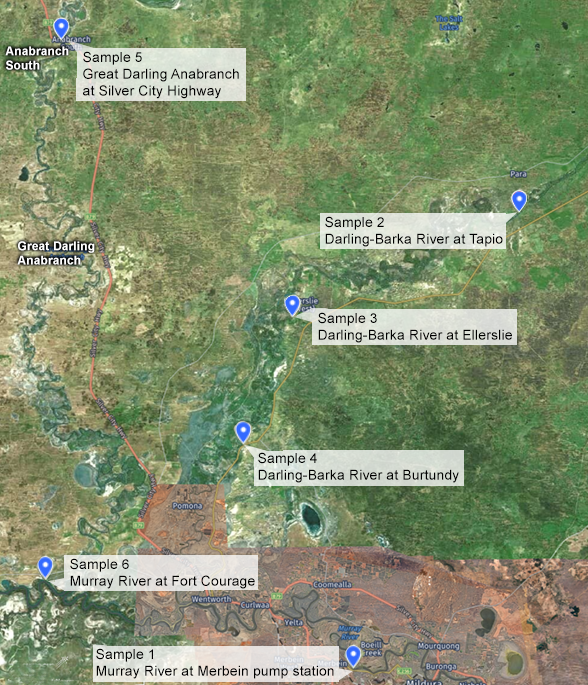
More sampling
The EPA is conducting regular water quality monitoring on the Darling-Barka River from upstream of Menindee to Pooncarie as well as the Great Darling Anabranch. The test results from these samples will also be published on this website.
In-field measurements
At the time of sampling, WaterNSW collected in-field measurements for pH, dissolved oxygen, conductivity, temperature and turbidity.
Dissolved oxygen ranged from 5.6mg/L to 10.3mg/L at the six locations. Native fish and other large aquatic organisms require at least 2mg/L of dissolved oxygen to survive but may begin to suffer if levels are below 4 to 5mg/L for prolonged periods.
pH was outside the guideline value in the Murray River at Merbein Pump Station and Fort Courage, and in the Great Darling Anabranch at Silver City Highway.
All other parameters are within the expected ranges.
| Sample name | Location | Temp (°C) | Dissolved oxygen (mg/L) | Electrical conductivity (µS/cm) | pH | Turbidity (NTU) |
|---|---|---|---|---|---|---|
|
1 |
Murray River at Merbein Pump Station |
19.0 |
9.1 |
292 |
8.2 |
14 |
|
2 |
Darling-Barka River at Tapio |
19.1 |
6.0 |
449 |
7.9 |
148 |
|
3 |
Darling-Barka River at Ellerslie |
19.2 |
5.7 |
458 |
7.9 |
183 |
|
4 |
Darling-Barka River at Burtundy |
19.3 |
5.6 |
468 |
7.8 |
163 |
|
5 |
Great Darling Anabranch at Silver City Highway |
18.7 |
10.3 |
489 |
8.9 |
61 |
|
6 |
Murray River at Fort Courage |
18.7 |
8.8 |
433 |
8.3 |
69 |
Nitrogen, phosphorus and ammonia
Sample results show that total nitrogen and total phosphorous are higher than the acceptable levels given for lowland river ecosystems in NSW (ANZG 2018, which are in agreement with the regionally specific set of guideline values for the Murray-Darling outlined in the Basin Plan 2012). Total nitrogen was detected at five times higher than the guideline value while total phosphorous was detected at ten times higher. Algal blooms are possible if these nutrients remain elevated.
Bacteria convert nitrogen compounds such as ammonia into nitrite and nitrate. These compounds can harm aquatic organisms. The water samples from 11 April show high levels of nitrite and nitrate, and there is a potential for further harm to aquatic organisms.
Ammonia was well below the Australian and New Zealand water quality guidelines for toxicity and as a stressor (i.e. nutrient). The levels would not be expected to be harmful to fish or promote growth in algae and aquatic plants.
Algae and algal toxins
A wide variety of algae was tested for. There were positive detections in all samples for a range of algal species, including blue-green algae. The algal toxin Cylindrospermopsin was detected in the samples collected from the Murray River at Fort Courage and the Great Darling Anabranch at Silver City Highway.
The algae levels detected fall within the ‘amber’ to ‘red’ alert levels. A ‘red alert’ is in place in the Murray River at Fort Courage and in the Great Darling Anabranch at Silver City Highway as of 28 April 2023. An ‘amber alert’ is in place in the Murray River at Merbein and in the Darling Barka River at Merbein, Ellerslie and Burtundy.
Pesticides
As noted above, a pesticide screening test that scanned for over 600 pesticides was completed for samples from all six locations. All samples came back negative for pesticide detection.
Metals
Many metals are vital for humans and animals to stay healthy and only pose a risk if they are found at high levels in the environment. Concentrations of key metals found in water are below.
Total metals have been compared to recreational water quality guidelines and dissolved metals have been compared to ecological water quality guidelines as per the National Health and Medical Research Council (NHMRC) recreational and Australian and New Zealand Water Quality (ANZG) guidelines, respectively.
Total metals provide a more conservative estimate of exposure from recreational use whereas dissolved metals are used for ecological assessments as this is the bioavailable fraction of the metal (the part that is toxic to organisms).
| Metal in Water | NHMRC (2008)2 | Sample (total acid-extractable metals) | |||||
|---|---|---|---|---|---|---|---|
| Recreational Water Guidelines | Sample 1 | Sample 2 | Sample 3 | Sample 4 | Sample 5 | Sample 6 | |
| (mg/L) | (mg/L) | (mg/L) | (mg/L) | (mg/L) | (mg/L) | (mg/L) | |
|
Aluminium |
No value |
0.29 |
4.7 |
4.9 |
4.3 |
1.7 |
2.2 |
|
Arsenic |
0.07 |
0.001 |
0.005 |
0.005 |
0.005 |
0.006 |
0.005 |
|
Chromium |
0.5 |
<0.001 |
0.005 |
0.005 |
0.004 |
0.002 |
0.002 |
|
Cobalt |
No value |
0.0005 |
0.0020 |
0.0024 |
0.0021 |
0.0019 |
0.0020 |
|
Copper |
20 |
0.0011 |
0.0060 |
0.0055 |
0.0051 |
0.0033 |
0.0032 |
|
Lead |
0.1 |
0.0004 |
0.0017 |
0.0021 |
0.0018 |
0.0010 |
0.0011 |
|
Nickel |
0.2 |
0.0010 |
0.0068 |
0.0070 |
0.0067 |
0.0043 |
0.0042 |
|
Zinc |
30 |
0.001 |
0.011 |
0.010 |
0.009 |
0.005 |
0.005 |
2NHMRC (2008) Guidelines for managing risks in recreational waters (10 x drinking water guideline value, Table 9.3)
|
Metal in Water
|
ANZG 20183 | Sample (dissolved metals) | |||||
|---|---|---|---|---|---|---|---|
| Water Quality Guideline for aquatic ecosystems (95% species protection) |
Sample 1 |
Sample 2 |
Sample 3 |
Sample 4 |
Sample 5 |
Sample 6 |
|
| (mg/L) |
(mg/L) |
(mg/L) |
(mg/L) |
(mg/L) |
(mg/L) |
(mg/L) |
|
|
Aluminium |
0.055 |
<0.04 |
<0.04 |
<0.04 |
<0.04 |
<0.04 |
<0.04 |
|
Arsenic |
0.013 |
<0.001 |
0.005 |
0.004 |
0.004 |
0.006 |
0.004 |
|
Cadmium |
0.0002 |
<0.0001 |
<0.0001 |
<0.0001 |
<0.0001 |
<0.0001 |
<0.0001 |
|
Chromium |
0.001 |
<0.001 |
<0.001 |
<0.001 |
<0.001 |
<0.001 |
<0.001 |
|
Cobalt |
No value |
<0.0001 |
0.0002 |
0.0002 |
0.0002 |
0.0007 |
0.0005 |
|
Copper |
0.0014 |
0.0006 |
0.0022 | 0.0019 | 0.0018 |
0.0014 |
0.0012 |
|
Lead |
0.0034 |
<0.0001 |
<0.0001 |
<0.0001 |
<0.0001 |
<0.0001 |
<0.0001 |
|
Manganese |
1.9 |
<0.001 |
0.003 |
<0.001 |
<0.001 |
<0.001 |
<0.001 |
|
Nickel |
0.011 |
0.0007 |
0.0032 |
0.0033 |
0.0031 |
0.0024 |
0.0022 |
|
Selenium |
0.005 |
<0.005 |
<0.005 |
<0.005 |
<0.005 |
<0.005 |
<0.005 |
|
Silver |
0.0005 |
<0.0001 |
<0.0001 |
<0.0001 |
<0.0001 |
<0.0001 |
<0.0001 |
|
Zinc |
0.008 |
<0.001 |
0.002 |
<0.001 |
<0.001 |
<0.001 |
<0.001 |
3ANZG (2018). Australian and New Zealand Guidelines for Fresh and Marine Water Quality. Australian and New Zealand Governments and Australian state and territory governments, Canberra ACT, Australia.
References
ANZG (2018), Australian and New Zealand Guidelines for Fresh and Marine Water Quality, Australian and New Zealand Governments and Australian state and territory governments, Canberra ACT, Australia. Available at www.waterquality.gov.au/anz-guidelines.
Basin Plan (2012), Schedule 11, Water Act 2007, Murray-Darling Basin Authority, Commonwealth of Australia.
NHMRC (2008), Guidelines for managing risks in recreational waters, Australian Government National Health and Medical Research Council.
Download the full test results: 11 April
- Report for metals and pesticides – 11 April, downstream of Menindee (PDF 2MB)
- Report for algal toxins – 11 April, downstream of Menindee (PDF 223KB)
- Report for algal identification and cell count – 11 April, downstream of Menindee (PDF 1.7MB)
- Report for nutrients – 11 April, downstream of Menindee (PDF 950KB)
The EPA collected two water samples on 4 April 2023 downstream of Menindee at Pooncarie.
Samples were checked for pesticides, excess nitrogen and phosphorus, ammonia, metals, bacteria, algae and algal toxins.
Summary
Pesticides
Samples were scanned for more than 600 pesticides. None were detected.
Nitrogen and phosphorus
Nitrogen and phosphorus remain at high levels. The water samples were taken after many fish had died so the high levels could be due to rotting fish. If nitrogen and phosphorus stay high they can cause algal blooms.
Algae and algal toxins
Algae, including blue-green algae, were detected in both samples. An ‘amber alert’ remains in place for the Darling-Barka River at Menindee and Pooncarie as of 24 April 2023. A low concentration of the algal toxin Cylindrospermopsin was detected in the sample collected from Karoola Reach.
Information about algae alerts is available at https://www.waternsw.com.au/water-services/water-quality/algae-alerts
Metals
Copper was slightly above the level set to protect water life but well below the level harmful to fish. All other metals were under the levels set to protect water life.
Bacterial
The concentrations of bacterial indicators, faecal coliforms and enterococci, are below guideline values for recreational use (NHMRC 2008).
Sample locations
Water was sampled on 4 April from two locations on the Darling-Barka River at Pooncarie:
- Sample 1 – Karoola Reach, approximately 60 kilometres north of Pooncarie
- Sample 2 – Pooncarie Bilbarka Park
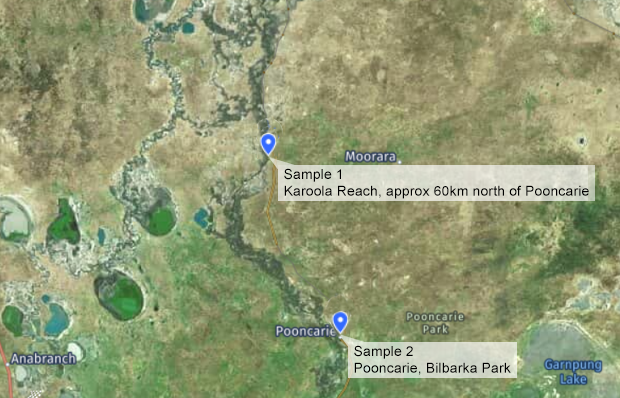
More sampling
WaterNSW has collected more water samples for the EPA from the Darling-Barka River on 11 April 2023. The test results for these samples will also be published on the EPA webpage.
In-field measurements
At the time of sampling, the EPA collected in-field measurements for pH, dissolved oxygen, conductivity, temperature and turbidity.
Dissolved oxygen at Site 1 was 2.53mg/L and at Site 2 was 3.11mg/L. Native fish and other large aquatic organisms require at least 2mg/L of dissolved oxygen to survive but may begin to suffer if levels are below 4 to 5mg/L for prolonged periods.
All other parameters were within the expected ranges.
|
Sample name |
Location |
Temp (°C) |
Dissolved oxygen (mg/L) |
Electrical conductivity (µS/cm) |
pH |
Turbidity (NTU) |
|---|---|---|---|---|---|---|
|
1 |
Karoola Reach, approximately 60km upstream from Pooncarie |
20.6 |
3.11 |
419 |
7.72 |
109.5 |
|
2 |
Pooncarie Bilbarka Park |
21.1 |
2.53 |
404 |
7.59 |
115.9 |
Nitrogen and phosphorus
Sample results show that total nitrogen and total phosphorous are higher than the acceptable levels given for lowland river ecosystems in NSW (ANZG 2018, which are in agreement with the regionally specific set of guideline values for the Murray-Darling outlined in the Basin Plan 2012). Total nitrogen was detected at five times higher than the guideline value while total phosphorous was detected at seven times higher. Algal blooms are possible if these nutrients remain elevated.
Bacteria convert nitrogen compounds such as ammonia into nitrite and nitrate. These compounds can harm aquatic organisms. The water samples from 4 April show high levels of nitrite and nitrate, and there is a potential for further harm to aquatic organisms.
Ammonia was well below the Australian and New Zealand water quality guidelines for toxicity. While the levels would not be expected to be harmful to fish, the ammonia could promote growth in algae and aquatic plants. The ammonia is likely to be from river sources including rotting fish and flood detritus rather than diffuse inputs from surrounding land.
Algae and algal toxins
A wide variety of algae was tested for. There were positive detections in both samples for a range of algal species, including blue-green algae, and common toxins produced by blue-green algae. A low concentration of the algal toxin Cylindrospermopsin was detected in the sample collected from Karoola Reach.
The algae levels detected fall within the ‘green’ to ‘amber’ alert levels. An amber alert remains in place at Menindee and Pooncarie as of 24 April 2023.
Pesticides
As noted above, a pesticide screening test that scanned for over 600 pesticides was completed for samples at both locations. Both samples came back negative for pesticide detection.
Metals
Many metals are vital for humans and animals to stay healthy and only pose a risk if they are found at high levels in the environment. Concentrations of key metals found in water are below.
Total metals have been compared to recreational water quality guidelines and dissolved metals have been compared to ecological water quality guidelines as per the National Health and Medical Research Council (NHMRC) recreational and Australian and New Zealand Water Quality (ANZG) guidelines, respectively.
Total metals provide a more conservative estimate of exposure from recreational use whereas dissolved metals are used for ecological assessments as this is the bioavailable fraction of the metal (the part that is toxic to organisms).
|
Metal in Water |
NHMRC (2008)2 |
Sample (total acid-extractable metals) |
|
|---|---|---|---|
|
Recreational Water Guidelines |
Sample 1 |
Sample 2 |
|
|
(mg/L) |
(mg/L) |
(mg/L) |
|
|
Aluminium |
No value |
5.7 |
5.3 |
|
Arsenic |
0.07 |
0.006 |
0.006 |
|
Chromium |
0.5 |
0.008 |
0.007 |
|
Cobalt |
No value |
0.0031 |
0.0026 |
|
Copper |
20 |
0.0063 |
0.0060 |
|
Lead |
0.1 |
0.0024 |
0.0022 |
|
Nickel |
0.2 |
0.0085 |
0.0079 |
|
Zinc |
30 |
0.012 |
0.012 |
2NHMRC (2008) Guidelines for managing risks in recreational waters (10 x drinking water guideline value, Table 9.3)
|
Metal in Water |
ANZG 20183 |
Sample (dissolved metals) |
|
|---|---|---|---|
|
Water Quality Guideline for aquatic ecosystems (95% species protection) |
Sample 1 |
Sample 2 |
|
|
(mg/L) |
(mg/L) |
(mg/L) |
|
|
Aluminium |
0.055 |
<0.04 |
<0.04 |
|
Arsenic |
0.013 |
0.005 |
0.005 |
|
Cadmium |
0.0002 |
<0.0001 |
<0.0001 |
|
Chromium |
0.001 |
<0.001 |
<0.001 |
|
Cobalt |
No value |
0.0003 |
0.0002 |
|
Copper |
0.0014 |
0.0018 |
0.0018 |
|
Lead |
0.0034 |
<0.0001 |
<0.0001 |
|
Manganese |
1.9 |
<0.001 |
<0.001 |
|
Nickel |
0.011 |
0.0031 |
0.0030 |
|
Selenium |
0.005 |
<0.005 |
<0.005 |
|
Silver |
0.0005 |
<0.0001 |
<0.0001 |
|
Zinc |
0.008 |
0.001 |
<0.001 |
3ANZG (2018). Australian and New Zealand Guidelines for Fresh and Marine Water Quality. Australian and New Zealand Governments and Australian state and territory governments, Canberra ACT, Australia.
Download the full test reports: 4 April
The full reports (with individual's names and addresses redacted for privacy) are available for download:
WaterNSW collected five water samples for the EPA on 3 April 2023.
Samples were checked for pesticides, excess nitrogen and phosphorus, ammonia, metals, algae and algal toxins.
Summary
Pesticides
Samples were scanned for more than 600 pesticides. None were detected.
Nitrogen and phosphorus
Nitrogen and phosphorous levels remain high. The water samples were taken after many fish had died so the high levels could be due to rotting fish. If nitrogen and phosphorus stay high they can cause algal blooms.
Algae and algal toxins
Algae, including blue-green algae, were detected in all five samples. An ‘amber alert’ remains in place for the Darling-Barka River at Menindee and Pooncarie as of 24 April 2023. No algal toxins were detected.
Information about algae alerts is available at https://www.waternsw.com.au/water-services/water-quality/algae-alerts
Metals
Copper remains slightly above the level set to protect water life but well below the level harmful to fish. All other metals were under the levels set to protect water life.
Sample locations
Water was sampled on 3 April 2023 from five locations on the Darling-Barka River between Main Weir and Weir 32:
- Sample 1 – Downstream of the main weir at Menindee
- Sample 2 – Menindee Water Treatment Plant
- Sample 3 – Upstream of Menindee Creek
- Sample 4 – Downstream of Menindee Creek
- Sample 5 – Upstream of Weir 32 at Menindee
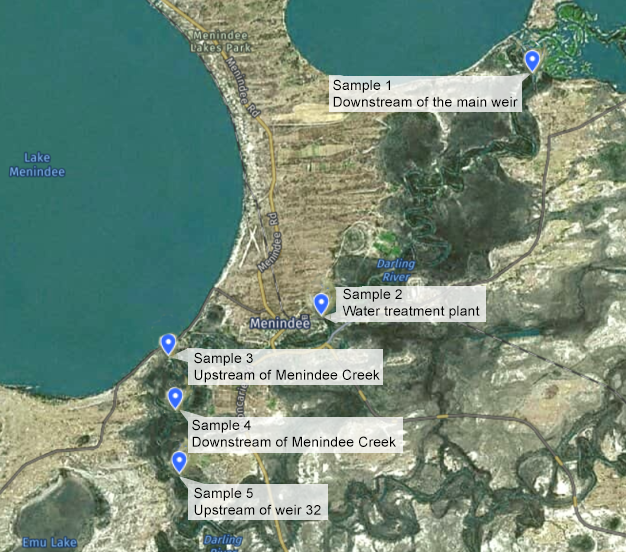
More sampling
The EPA and WaterNSW have collected more water samples from the Darling-Barka River downstream in the Pooncarie area on 11 April 2023. The test results from these samples will also be published on the EPA webpage.
In-field measurements
At the time of sampling, WaterNSW collected in-field measurements for pH, dissolved oxygen, conductivity and temperature.
Dissolved oxygen ranged from 1.82mg/L to 7.04mg/L at the five locations. Native fish and other large aquatic organisms require at least 2mg/L of dissolved oxygen to survive but may begin to suffer if levels are below 4 to 5mg/L for prolonged periods. One of the five sample locations detected dissolved oxygen levels below 2 mg/L.
All other parameters are within the expected ranges.
|
Sample name |
Location |
Temp (°C) |
Dissolved oxygen (mg/L) |
Electrical conductivity (µS/cm) |
pH |
|---|---|---|---|---|---|
|
1 |
Downstream Main Weir |
19.4 |
7.04 |
515 |
7.72 |
|
2 |
Water treatment plant |
20.5 |
2.79 |
508 |
7.63 |
|
3 |
Upstream Menindee Creek |
20.5 |
1.82 |
506 |
7.62 |
|
4 |
Downstream several kms of Menindee Creek |
19.1 |
6.68 |
439.3 |
8.08 |
|
5
|
Upstream of Weir 32 |
19.4 |
6.39 |
437.6 |
8.04 |
Nitrogen, phosphorus and ammonia
Sample results show that total nitrogen and total phosphorous are higher than the acceptable levels given for lowland river ecosystems in NSW (ANZG 2018, which are in agreement with the regionally specific set of guideline values for the Murray-Darling outlined in the Basin Plan 2012). Total nitrogen was detected at four times higher than the guideline value while total phosphorous was detected at seven times higher. Algal blooms are possible if these nutrients remain elevated.
Bacteria convert nitrogen compounds such as ammonia into nitrite and nitrate. These compounds can harm aquatic organisms. The water samples from 3 April show high levels of nitrite and nitrate, and there is a potential for further harm to aquatic organisms.
Ammonia was well below the Australian and New Zealand water quality guidelines for toxicity. While the levels would not be expected to be harmful to fish, the ammonia could promote growth in algae and aquatic plants. The ammonia is likely to be from river sources including rotting fish and flood organic matter rather than diffuse inputs from surrounding land.
Algae and algal toxins
A wide variety of algae was tested for. There were positive detections in all samples for a range of algal species, including blue-green algae.
The algae levels detected fall within the ‘green’ to ‘amber’ alert levels. An amber alert remains in place at Menindee and Pooncarie as of 24 April 2023. No algal toxins were detected.
Pesticides
As noted above, a pesticide screening test that scanned for over 600 pesticides was completed for samples from all five locations. All samples came back negative for pesticide detection.
Metals
Many metals are vital for humans and animals to stay healthy and only pose a risk if they are found at high levels in the environment. Concentrations of key metals found in water are below.
Total metals have been compared to recreational water quality guidelines and dissolved metals have been compared to ecological water quality guidelines as per the National Health and Medical Research Council (NHMRC) recreational and Australian and New Zealand Water Quality (ANZG) guidelines, respectively.
Total metals provide a more conservative estimate of exposure from recreational use whereas dissolved metals are used for ecological assessments as this is the bioavailable fraction of the metal (the part that is toxic to organisms).
|
Metal in Water |
NHMRC (2008)2 |
Sample (total acid-extractable metals) |
||||
|---|---|---|---|---|---|---|
|
Recreational Water Guidelines (mg/L) |
Sample 1 |
Sample 2 |
Sample 3 |
Sample 4 |
Sample 5 |
|
|
(mg/L) |
(mg/L) |
(mg/L) |
(mg/L) |
(mg/L) |
||
|
Aluminium |
No value |
2.2 |
3.5 |
3.3 |
4.7 |
4.7 |
|
Arsenic |
0.07 |
0.003 |
0.003 |
0.003 |
0.005 |
0.005 |
|
Chromium |
0.5 |
0.002 |
0.004 |
0.004 |
0.005 |
0.005 |
|
Cobalt |
No value |
0.0016 |
0.0021 |
0.0020 |
0.0019 |
0.0019 |
|
Copper |
20 |
0.0028 |
0.0037 |
0.0035 |
0.0051 |
0.0052 |
|
Lead |
0.1 |
0.0010 |
0.0017 |
0.0015 |
0.0016 |
0.0016 |
|
Nickel |
0.2 |
0.0051 |
0.0063 |
0.0060 |
0.0063 |
0.0062 |
|
Zinc |
30 |
0.005 |
0.007 |
0.007 |
0.009 |
0.009 |
2NHMRC (2008) Guidelines for managing risks in recreational waters (10 x drinking water guideline value, Table 9.3)
|
Metal in Water |
ANZG 20183 |
Sample (dissolved metals) |
||||
|---|---|---|---|---|---|---|
|
Water Quality Guideline for aquatic ecosystems (95% species protection) (mg/L) |
Sample 1 (mg/L) |
Sample 2 (mg/L) |
Sample 3 (mg/L) |
Sample 4 (mg/L) |
Sample 5 (mg/L) |
|
|
Aluminium |
0.055 |
<0.04 |
<0.04 |
<0.04 |
<0.04 |
<0.04 |
|
Arsenic |
0.013 |
0.003 |
0.003 |
0.003 |
0.003 |
0.003 |
|
Cadmium |
0.0002 |
<0.0001 |
<0.0001 |
<0.0001 |
<0.0001 |
<0.0001 |
|
Chromium |
0.001 |
<0.001 |
<0.001 |
<0.001 |
<0.001 |
<0.001 |
|
Cobalt |
No value |
0.0002 |
0.0002 |
0.0002 |
0.0002 |
0.0002 |
|
Copper |
0.0014 |
0.0012 |
0.0011 |
0.0010 |
0.0019 |
0.0020 |
|
Lead |
0.0034 |
<0.0001 |
<0.0001 |
<0.0001 |
<0.0001 |
<0.0001 |
|
Manganese |
1.9 |
<0.001 |
<0.001 |
<0.001 |
<0.001 |
<0.001 |
|
Nickel |
0.011 |
0.0032 |
0.0034 |
0.0034 |
0.0026 |
0.0026 |
|
Selenium |
0.005 |
<0.005 |
<0.005 |
<0.005 |
<0.005 |
<0.005 |
|
Silver |
0.0005 |
<0.0001 |
<0.0001 |
<0.0001 |
<0.0001 |
<0.0001 |
|
Zinc |
0.008 |
<0.001 |
<0.001 |
<0.001 |
<0.001 |
<0.001 |
3ANZG (2018). Australian and New Zealand Guidelines for Fresh and Marine Water Quality. Australian and New Zealand Governments and Australian state and territory governments, Canberra ACT, Australia.
Download the full test reports: 3 April
The full reports (with individual's names and addresses redacted for privacy) are available for download:
The EPA collected two water samples on 30 March downstream of Menindee at Pooncarie and approximately 60 kilometres upstream of Pooncarie.
Samples were checked for pesticides, excess nitrogen and phosphorus, metals, algae and algal toxins.
Summary
Pesticides
Samples were scanned for more than 600 pesticides. None were detected.
Nitrogen and phosphorus
Nitrogen and phosphorus remain at high levels. The water samples were taken after many fish had died so the high levels could be due to rotting fish. If nitrogen and phosphorus stay high they can cause algal blooms.
Algae
Algae, including blue-green algae, were detected in both samples. An ‘amber alert’ remains in place for the Darling River at Menindee and Pooncarie as of 20 April 2023.
Information about algae alerts is available here https://www.waternsw.com.au/water-services/water-quality/algae-alerts
Metals
Copper remains slightly above the level set to protect water life but well below the level lethal to fish. All other metals were under the levels set to protect water life.
Sample locations
Water was sampled on 30 March from two locations on the Darling River downriver of Menindee:
- Sample 1 – Approximately 60 kilometres upstream of Pooncarie. This site is identified as DRKR on the full sample results.
- Sample 2 – Old Wharf Pooncarie. This site is identified at DRPW on the full sample results.
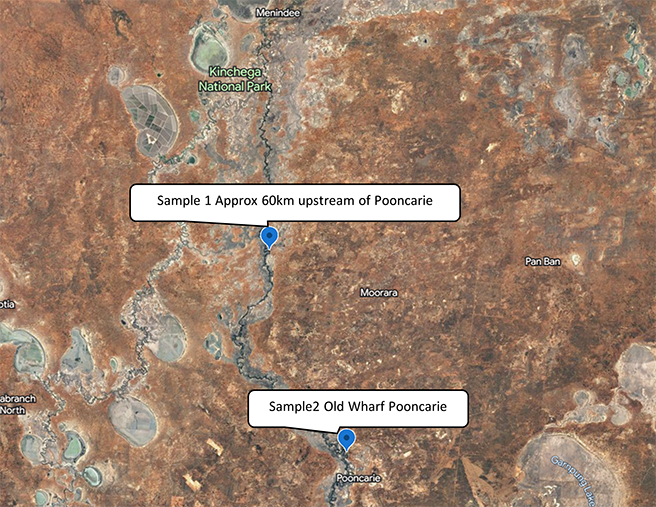
More sampling
The EPA and WaterNSW have collected more water samples from the Darling River in the Menindee area and downstream in the Pooncarie area on 3, 4 and 11 April. The test results from these samples will also be published on the EPA webpage.
In-field measurements
At the time of sampling, the EPA collected in-field measurements for pH, dissolved oxygen, conductivity, temperature and turbidity.
Dissolved oxygen ranged from 2.75 mg/L to 3.56mg/L at the two locations. Native fish and other large aquatic organisms require at least 2mg/L of dissolved oxygen to survive but may begin to suffer if levels are below 4 to 5mg/L for prolonged periods.
All other parameters are within the expected ranges.
|
Sample name |
Location |
Temp (°C) |
Dissolved oxygen (mg/L) |
Conductivity (µS/cm) |
pH |
Turbidity (NTU) |
|---|---|---|---|---|---|---|
|
1 |
Approximately 60km upstream of Pooncarie (Karoola Reach) |
21.9 |
3.56 |
417 |
7.73 |
148 |
|
2 |
Old Wharf Pooncarie |
22.2 |
2.75 |
420 |
7.65 |
114 |
Nitrogen, phosphorus and ammonia
Sample results show that total nitrogen and total phosphorous are higher than the acceptable levels given for lowland river ecosystems in NSW (ANZG 2018, which are in agreement with the regionally specific set of guideline values for the Murray-Darling outlined in the Basin Plan 2012). Total nitrogen was detected at six times higher than the guideline value while total phosphorous was detected at nine times higher. Algal blooms are possible if these nutrients remain elevated.
Bacteria convert nitrogen compounds such as ammonia into nitrite and nitrate. These compounds can harm aquatic organisms. The water samples from 30 March show high levels of nitrite and nitrate, and there is a potential for further harm to aquatic organisms.
Ammonia was well below the Australian and New Zealand water quality guidelines for toxicity. While the levels would not be expected to be harmful to fish, the ammonia could promote growth in algae and macrophytes. The ammonia is likely to be from river sources including rotting fish and flood detritus rather than diffuse inputs from surrounding land.
Algae and algal toxins
A wide variety of algae was tested for. There were positive detections in all samples for a range of algal species, including blue-green algae, and common toxins produced by blue-green algae.
The algae levels detected fall within the ‘green’ to ‘amber’ alert levels. An amber alert remains in place at Menindee and Pooncarie as of 20 April 2023.
Pesticides
As noted above, a pesticide screening test that scanned for over 600 pesticides was completed for samples from both locations. All samples came back negative for pesticide detection.
Metals
Many metals are vital for humans and animals to stay healthy and only pose a risk if they are found at high levels in the environment. Concentrations of key metals found in water are below.
Total metals have been compared to recreational water quality guidelines and dissolved metals have been compared to ecological water quality guidelines as per the National Health and Medical Research Council (NHMRC) recreational and Australian and New Zealand Water Quality (ANZG) guidelines, respectively.
Total metals provide a more conservative estimate of exposure from recreational use whereas dissolved metals are used for ecological assessments as this is the bioavailable fraction of the metal (the part that is toxic to organisms).
|
Metal in Water |
NHMRC (2008)2 |
Sample (total acid-extractable metals) |
|
|---|---|---|---|
|
Recreational Water Guidelines (mg/L) |
Sample 1 |
Sample 2 |
|
|
Aluminium |
No value |
3.4 |
3.3 |
|
Arsenic |
0.07 |
0.005 |
0.006 |
|
Chromium |
0.5 |
0.004 |
0.004 |
|
Cobalt |
No value |
0.0018 |
0.0019 |
|
Copper |
20 |
0.0048 |
0.0049 |
|
Lead |
0.1 |
0.0016 |
0.0015 |
|
Nickel |
0.2 |
0.0061 |
0.0065 |
|
Zinc |
30 |
0.008 |
0.008 |
2NHMRC (2008) Guidelines for managing risks in recreational waters (10x drinking water guideline value, Table 9.3)
|
Metal in Water |
ANZG 20183 |
Sample (dissolved metals) |
|
|---|---|---|---|
|
Water Quality Guideline for aquatic ecosystems (95% species protection) (mg/L) |
Sample 1 (mg/L) |
Sample 2 (mg/L) |
|
|
Aluminium |
0.055 |
<0.04 |
<0.04 |
|
Arsenic |
0.013 |
0.005 |
0.006 |
|
Cadmium |
0.0002 |
<0.0001 |
<0.0001 |
|
Chromium |
0.001 |
<0.001 |
<0.001 |
|
Cobalt |
No value |
0.0002 |
0.0002 |
|
Copper |
0.0014 |
0.0019 |
0.0018 |
|
Lead |
0.0034 |
<0.0001 |
<0.0001 |
|
Manganese |
1.9 |
<0.001 |
<0.001 |
|
Nickel |
0.011 |
0.0029 |
0.0031 |
|
Selenium |
0.011 |
<0.005 |
<0.005 |
|
Silver |
0.0005 |
<0.0001 |
<0.0001 |
|
Zinc |
0.008 |
<0.001 |
<0.001 |
3ANZG (2018). Australian and New Zealand Guidelines for Fresh and Marine Water Quality. Australian and New Zealand Governments and Australian state and territory governments, Canberra ACT, Australia.
Download the full test reports: 30 March
The full reports (with individual's names and addresses redacted for privacy) are available for download:
WaterNSW collected five water samples for the NSW Environment Protection Authority (EPA) on 30 March.
Samples were checked for pesticides, excess nitrogen and phosphorus, metals, algae and algal toxins.
Summary
Pesticides
Samples were scanned for more than 600 pesticides. None were detected.
Nitrogen and phosphorus
Nitrogen and phosphorus remain at high levels. The water samples were taken after many fish had died so the high levels could be due to rotting fish. If nitrogen and phosphorus stay high they can cause algal blooms.
Algae
Algae, including blue-green algae, were detected in five samples. An ‘amber alert’ remains in place for the Darling River at Menindee and Pooncarie as of 20 April 2023.
Information about algae alerts is available here https://www.waternsw.com.au/water-services/water-quality/algae-alerts
Metals
Copper remains slightly above the level set to protect water life but well below the level lethal to fish. All other metals were under the levels set to protect water life.
Sample locations
Water was sampled on 30 March from five locations on the Darling River between Main Weir and Weir 32:
- Sample 2– Downstream of the main weir at Menindee.
- Sample 3 – Menindee Water Treatment Plant
- Sample 4 – Upstream of Menindee Creek
- Sample 6 – Several kilometres downstream of Menindee Creek
- Sample 7 – Downstream of Weir 32
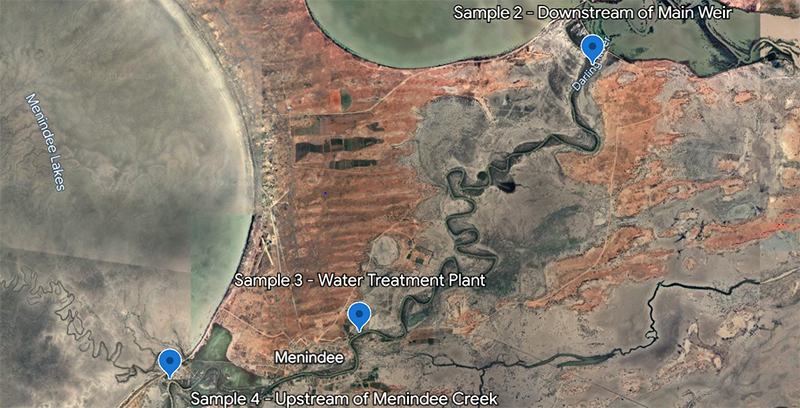
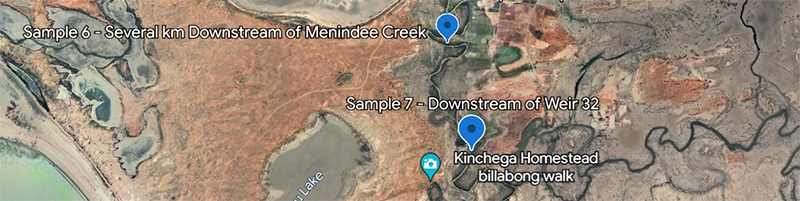
In-field measurements
At the time of sampling, WaterNSW collected in-field measurements for pH, dissolved oxygen, conductivity, temperature and turbidity.
Dissolved oxygen ranged from 0.73mg/L to 5.85mg/L at the five locations. Native fish and other large aquatic organisms require at least 2mg/L of dissolved oxygen to survive but may begin to suffer if levels are below 4 to 5mg/L for prolonged periods. Two of the five sample locations detected dissolved oxygen levels below 2 mg/L.
All other parameters are within the expected ranges.
|
Sample name |
Location |
Temp (°C) |
Dissolved oxygen (mg/L) |
Electrical conductivity (µS/cm) |
pH |
Turbidity (NTU) |
|---|---|---|---|---|---|---|
|
2 |
Downstream Main Weir |
21.5 |
5.85 |
515 |
7.69 |
50 |
|
3 |
Water treatment plant |
22.3 |
1.4 |
519 |
7.44 |
55 |
|
4 |
Upstream Menindee Creek |
22.2 |
0.73 |
499 |
7.46 |
68.1 |
|
6 |
Downstream several kms of Menindee Creek |
21.5 |
5.01 |
443.6 |
7.78 |
97 |
|
7
|
Downstream of Weir 32 |
21.7 |
4.78 |
443.1 |
7.69 |
101.4 |
Nitrogen, phosphorus and ammonia
Sample results show that total nitrogen and total phosphorous are higher than the acceptable levels given for lowland river ecosystems in NSW (ANZG 2018, which are in agreement with the regionally specific set of guideline values for the Murray-Darling outlined in the Basin Plan 2012). Total nitrogen was detected at five times higher than the guideline value while total phosphorous was detected at seven times higher. Algal blooms are possible if these nutrients remain elevated.
Bacteria convert nitrogen compounds such as ammonia into nitrite and nitrate. These compounds can harm aquatic organisms. The water samples from 30 March show high levels of nitrite and nitrate, and there is a potential for further harm to aquatic organisms.
Ammonia was well below the Australian and New Zealand water quality guidelines for toxicity. While the levels would not be expected to be harmful to fish, the ammonia could promote growth in algae and aquatic plants. The ammonia is likely to be from river sources including rotting fish and flood detritus rather than diffuse inputs from surrounding land.
Algae and algal toxins
A wide variety of algae was tested for. There were positive detections in all samples for a range of algal species, including blue-green algae, and common toxins produced by blue-green algae.
The algae levels detected fall within the ‘green’ to ‘amber’ alert levels. An amber alert remains in place at Menindee and Pooncarie as of 20 April 2023.
Pesticides
As noted above, a pesticide screening test that scanned for over 600 pesticides was completed for samples from all five locations. All samples came back negative for pesticide detection.
Metals
Many metals are vital for humans and animals to stay healthy and only pose a risk if they are found at high levels in the environment. Concentrations of key metals found in water are below.
Total metals have been compared to recreational water quality guidelines and dissolved metals have been compared to ecological water quality guidelines as per the National Health and Medical Research Council (NHMRC) recreational and Australian and New Zealand Water Quality (ANZG) guidelines, respectively.
Total metals provide a more conservative estimate of exposure from recreational use whereas dissolved metals are used for ecological assessments as this is the bioavailable fraction of the metal (the part that is toxic to organisms).
|
Metal in Water |
NHMRC (2008)2 |
Sample (total acid-extractable metals) |
||||
|---|---|---|---|---|---|---|
|
Recreational Water Guidelines (mg/L) |
Sample 2 |
Sample 3 |
Sample 4 |
Sample 6 |
Sample 7 |
|
|
(mg/L) |
(mg/L) |
(mg/L) |
(mg/L) |
(mg/L) |
||
|
Aluminium |
No value |
2 |
2.2 |
2.7 |
3.9 |
4.1 |
|
Arsenic |
0.07 |
0.003 |
0.003 |
0.004 |
0.005 |
0.005 |
|
Chromium |
0.5 |
0.003 |
0.003 |
0.003 |
0.005 |
0.005 |
|
Cobalt |
No value |
0.0019 |
0.0020 |
0.0018 |
0.0019 |
0.0019 |
|
Copper |
20 |
0.0031 |
0.0030 |
0.0033 |
0.0049 |
0.0050 |
|
Lead |
0.1 |
0.0012 |
0.0014 |
0.0015 |
0.0016 |
0.0018 |
|
Nickel |
0.2 |
0.0054 |
0.0055 |
0.0059 |
0.0062 |
0.0065 |
|
Zinc |
30 |
0.005 |
0.005 |
0.007 |
0.008 |
0.009 |
2NHMRC (2008) Guidelines for managing risks in recreational waters (10 x drinking water guideline value, Table 9.3)
|
Metal in Water |
ANZG 20183 |
Sample (dissolved metals) |
||||
|---|---|---|---|---|---|---|
|
Water Quality Guideline for aquatic ecosystems (95% species protection) (mg/L) |
Sample 2 (mg/L) |
Sample 3 (mg/L) |
Sample 4 (mg/L) |
Sample 6 (mg/L) |
Sample 7 (mg/L) |
|
|
Aluminium |
0.055 |
<0.04 |
<0.04 |
<0.04 |
<0.04 |
<0.04 |
|
Arsenic |
0.013 |
0.003 |
0.003 |
0.003 |
0.005 |
0.005 |
|
Cadmium |
0.0002 |
<0.0001 |
<0.0001 |
<0.0001 |
<0.0001 |
<0.0001 |
|
Chromium |
0.001 |
<0.001 |
<0.001 |
<0.001 |
<0.001 |
<0.001 |
|
Cobalt |
No value |
0.0002 |
0.0003 |
0.0002 |
0.0002 |
0.0002 |
|
Copper |
0.0014 |
0.0011 |
0.0007 |
0.0009 |
0.0018 |
0.0018 |
|
Lead |
0.0034 |
<0.0001 |
<0.0001 |
<0.0001 |
<0.0001 |
<0.0001 |
|
Manganese |
1.9 |
<0.001 |
<0.001 |
<0.001 |
<0.001 |
<0.001 |
|
Nickel |
0.011 |
0.0031 |
0.0032 |
0.0035 |
0.0028 |
0.0029 |
|
Selenium |
0.011 |
<0.005 |
<0.005 |
<0.005 |
<0.005 |
<0.005 |
|
Silver |
0.0005 |
<0.0001 |
<0.0001 |
<0.0001 |
<0.0001 |
<0.0001 |
|
Zinc |
0.008 |
<0.001 |
<0.001 |
<0.001 |
<0.001 |
<0.001 |
3ANZG (2018). Australian and New Zealand Guidelines for Fresh and Marine Water Quality. Australian and New Zealand Governments and Australian state and territory governments, Canberra ACT, Australia.
Download the full test reports: 30 March
The full reports (with individual's names and addresses redacted for privacy) are available for download:
Summary
Pesticides
Samples were scanned for more than 600 pesticides. None were detected.
Nitrogen and phosphorus
Nitrogen and phosphorus were at high levels. The water samples were taken after many fish had died so the high levels could be due to rotting fish. If nitrogen and phosphorus stay high they can cause algal blooms.
Algae
Algae, including blue-green algae, were detected in all six samples. An ‘amber alert’ is now in place for this part of the river. This means:
- people should not drink untreated river water.
Metals
Levels of metals were within the limits set for recreational use – that is, swimming and canoeing are OK. Copper was above the level set to protect water life but well below the level harmful to fish. All other metals were under the levels set to protect water life.
Sample locations
Water was sampled on 21 March from six locations on the Darling River between the outlet at Main Weir and Weir 32:
- Sample 1 – Outlet to Lake Pamamaroo
- Sample 2 – Downstream Main Weir
- Sample 3 – Darling River at the Menindee Rail Bridge
- Sample 4 – Darling River upstream of Menindee Creek
- Sample 5 – Darling River several kilometres downstream from Menindee outlet.
- Sample 6 – Weir 32

In-field measurements
At the time of sampling, WaterNSW collected in-field measurements for pH, dissolved oxygen, conductivity, temperature and turbidity.
Dissolved oxygen ranged from 0.41mg/L to 5.97mg/L at the six locations. Native fish and other large aquatic organisms require at least 2mg/L of dissolved oxygen to survive but may begin to suffer if levels are below 4 to 5mg/L for prolonged periods. Three of the six sample locations detected dissolved oxygen levels below 3 mg/L.
One sample taken from the Darling River, upstream of Menindee Creek detected dissolved oxygen levels below 1mg/L. Dissolved oxygen lower than 1 mg/L can be lethal for animals that can’t move to oxygen-rich areas.
All other parameters are within the expected range.
|
Sample name |
Location |
Temp (°C) |
Dissolved oxygen (mg/L) |
Conductivity compensated (SPC – µS/cm) |
pH |
Turbidity (NTU) |
|---|---|---|---|---|---|---|
|
1 |
Outlet to Lake Pamamaroo |
22.6 |
5.97 |
478 |
7.8 |
109 |
|
2 |
DS Main Weir |
23.0 |
1.83 |
529 |
7.5 |
73.3 |
|
3 |
Darling River at the Menindee rail bridge/town water offtake |
24.5 |
1.21 |
671 |
7.6 |
61.0 |
|
4 |
Darling River u/s of Menindee Creek |
24.4 |
0.41 |
478 |
7.5 |
45.4 |
|
5 |
Darling River several km downstream of Menindee outlet |
22.6 |
4.84 |
420 |
7.9 |
120 |
|
6 |
Weir 32 |
22.9 |
4.18 |
421 |
7.8 |
123 |
Nitrogen and phosphorus
Sample results show that Total Nitrogen and Total Phosphorous are higher than the trigger values given for lowland river ecosystems in NSW (ANZG 2018). Total nitrogen was detected at eight times higher than the guideline value while total phosphorous was detected at eleven times higher. Algal blooms are possible if these nutrients remain elevated.
Bacteria convert nitrogen compounds such as ammonia into nitrite and nitrate. These compounds can harm aquatic organisms. The water samples from 21 March show high levels of ammonia, nitrite and nitrate, and there is a potential for harm to aquatic organisms.
Algae and algal toxins
A wide variety of algae was tested for. There were positive detections in all six samples for a range of algae species, including blue-green algae.
WaterNSW has advised that the algae levels detected fall within the ‘green’ to ‘amber’ alert levels. An amber alert is currently in place.
Pesticides
As noted above, a pesticide screening test that scanned for over 600 pesticides was completed for samples from all six locations. All samples came back negative for pesticide detection.
Metals
Many metals are vital for humans and animals to stay healthy and only pose a risk if they are found at high levels in the environment. Concentrations of key metals found in water are below.
Total metals have been compared to recreational water quality guidelines and dissolved metals have been compared to ecological water quality guidelines as per NHMRC and ANZECC guidelines, respectively.
Total metals provide a more conservative estimate of exposure from recreational use whereas dissolved metals are used for ecological assessments as this is the bioavailable fraction of the metal (the part that is toxic to organisms).
|
Metal in Water |
NHMRC (2008)2 |
Sample (total acid-extractable metals) |
|||||
|---|---|---|---|---|---|---|---|
|
Recreational Water Guidelines (mg/L) |
Water1 (mg/L) |
Water2 (mg/L) |
Water3 (mg/L) |
Water4 (mg/L) |
Water5 (mg/L) |
Water6 (mg/L) |
|
|
Aluminium |
No value |
4.1 |
0.88 |
2.1 |
0.73 |
1.9 |
1.4 |
|
Arsenic |
0.07 |
0.005 |
0.004 |
0.005 |
0.004 |
0.006 |
0.005 |
|
Chromium |
0.5 |
0.005 |
<0.001 |
0.002 |
<0.001 |
0.002 |
0.002 |
|
Cobalt |
No value |
0.0023 |
0.0006 |
0.0011 |
0.0008 |
0.0006 |
0.0005 |
|
Copper |
20 |
0.0050 |
0.0026 |
0.0033 |
0.0017 |
0.0041 |
0.0091 |
|
Lead |
0.1 |
0.0018 |
0.0004 |
0.0009 |
0.0004 |
0.0005 |
0.0004 |
|
Nickel |
0.2 |
0.0071 |
0.0042 |
0.0054 |
0.0044 |
0.0040 |
0.0037 |
|
Zinc |
30 |
0.009 |
0.002 |
0.004 |
0.002 |
0.003 |
0.003 |
2NHMRC (2008) Guidelines for managing risks in recreational waters (10 x drinking water guideline value, Table 9.3)
|
Metal in Water |
ANZG 20183 |
Sample (dissolved metals) |
|||||
|---|---|---|---|---|---|---|---|
|
Water Quality Guideline for aquatic ecosystems (95% species protection) (mg/L) |
Water1 (mg/L) |
Water2 (mg/L) |
Water3 (mg/L) |
Water4 (mg/L) |
Water5 (mg/L) |
Water6 (mg/L) |
|
|
Aluminium |
0.055 |
<0.04 |
<0.04 |
<0.04 |
<0.04 |
<0.04 |
<0.04 |
|
Arsenic |
0.013 |
0.004 |
0.004 |
0.005 |
0.004 |
0.006 |
0.005 |
|
Cadmium |
0.0002 |
<0.0001 |
<0.0001 |
<0.0001 |
<0.0001 |
<0.0001 |
<0.0001 |
|
Chromium |
0.001 |
<0.001 |
<0.001 |
<0.001 |
<0.001 |
<0.001 |
<0.001 |
|
Cobalt |
No value |
0.0003 |
0.0003 |
0.0003 |
0.0006 |
0.0002 |
0.0001 |
|
Copper |
0.0014 |
0.0025 |
0.0018 |
0.0019 |
0.0018 |
0.0016 |
0.0016 |
|
Lead |
0.0034 |
<0.0001 |
<0.0001 |
<0.0001 |
<0.0001 |
<0.0001 |
<0.0001 |
|
Manganese |
1.9 |
<0.001 |
<0.001 |
0.008 |
0.073 |
<0.001 |
<0.001 |
|
Nickel |
0.011 |
0.0037 |
0.0034 |
0.0037 |
0.0036 |
0.0028 |
0.0029 |
|
Selenium |
0.011 |
<0.005 |
<0.005 |
<0.005 |
<0.005 |
<0.005 |
<0.005 |
|
Silver |
0.0005 |
<0.0001 |
<0.0001 |
<0.0001 |
<0.0001 |
<0.0001 |
<0.0001 |
|
Zinc |
0.008 |
<0.001 |
<0.001 |
<0.001 |
<0.001 |
<0.001 |
<0.001 |
3ANZG (2018). Australian and New Zealand Guidelines for Fresh and Marine Water Quality. Australian and New Zealand Governments and Australian state and territory governments, Canberra ACT, Australia.
Download the full test reports: 21 March
The full reports (with individual's names and addresses redacted for privacy) are available for download: