
Hunter River Salinity Trading Scheme 2021-22 Performance
The Hunter River Salinity Trading Scheme performed well in the 2021-22 financial year by largely maintaining electrical conductivity levels in the river within target levels during periods of industry discharge.
Summary
The Hunter River Salinity Trading Scheme performed well in the 2021–22 financial year by largely maintaining electrical conductivity (EC) levels in the river within target levels during periods of industry discharge. This was despite unprecedented high rainfall and flows in the Hunter River leading to increased salt loads carried past Singleton. The extreme wet weather also presented water storage and management challenges for industry. However, participants managed their onsite water within the regulatory framework, only discharging during available opportunities. In doing so, participants have supported the overall scheme objective, by balancing their need to discharge with the needs of agricultural water users. The EPA acknowledges the challenges for industry and will be reviewing the scheme to ensure its continuing effectiveness in extreme weather events.
Scheme performance during 2021–22
There were 15 industry participants during the 2021–22 financial year:
- 10 participants discharged
- 3 did not discharge
- 2 did not hold discharge licences.
Table 1 Hunter River Salinity Trading Scheme participants 2021–22 and discharge status
|
Sector |
Participant |
Facility Name/ Discharge Location |
Status |
|---|---|---|---|
|
Upper |
AQC Dartbrook Management Pty Ltd |
Dartbrook Coal Mine |
Discharger (inactive)
|
|
Upper |
Hunter Valley Energy Coal Pty Ltd |
Mount Arthur Coal |
Discharger (inactive)
|
|
Upper |
Bengalla Mining Company Pty Ltd |
Bengalla Mine |
Discharger (active) |
|
Upper |
Mangoola Coal Operations Pty Ltd |
Mangoola Coal Operations |
Discharger (active) |
|
Middle |
HV Operations Pty Ltd |
Hunter Valley Operations (Parnells Dam) |
Discharger (active) |
|
Middle |
HV Operations Pty Ltd |
Hunter Valley Operations (Dam 11N) |
Discharger (active) |
|
Middle |
Liddell Coal Operations Pty Ltd |
Liddell Coal Operations |
Discharger (active) |
|
Middle |
AGL Macquarie Pty Ltd |
Bayswater Power Station |
Discharger (active) |
|
Middle |
Mt Owen Pty Ltd |
Mount Owen Mine |
Non-discharger |
|
Middle |
Ravensworth Operations Pty Ltd |
Ravensworth Mining Complex |
Discharger (active) |
|
Lower |
HV Operations Pty Ltd |
Hunter Valley Operations (Lake James) |
Discharger (active) |
|
Lower |
Wambo Coal Pty Ltd |
Wambo Coal |
Discharger (active) |
|
Lower |
Verdant Earth Technologies Ltd |
Redbank Power Station |
Discharger (active) |
|
Lower |
Bulga Coal Management Pty Ltd |
Bulga Coal Complex |
Discharger (active) |
|
Lower |
Warkworth Mining Ltd |
Warkworth Coal Mine |
Discharger (inactive) |
|
Lower |
Mount Thorley Operations Pty Ltd |
Mount Thorley Operations |
Discharger (active) |
|
Credit holder only |
Mach Energy Australia Pty Ltd |
Mount Pleasant Operation |
Non-discharger |
During the 2021–22 financial year, the Hunter River catchment received higher rainfall compared to past years. This resulted in high flows, increased water held on sites, and increased discharge opportunities.
There were 313 discharge opportunities overall and no discharges occurred outside of these periods. Participants used 218 of these opportunities, generating 415 individual discharge events.
Table 2 Breakdown of discharge opportunities and events per sector in 2021–22
|
Sector |
Opportunities |
Opportunities taken |
% Opportunities Taken |
Discharge events across opportunities |
Active discharge points |
|---|---|---|---|---|---|
|
Upper |
49 |
23 |
47% |
38 |
2 |
|
Middle |
118 |
98 |
83% |
224 |
5 |
|
Lower |
147 |
97 |
66% |
153 |
5 |
|
TOTAL |
313 |
218 |
- |
415 |
12 |
Performance during industry discharge events
Water discharged and total flow
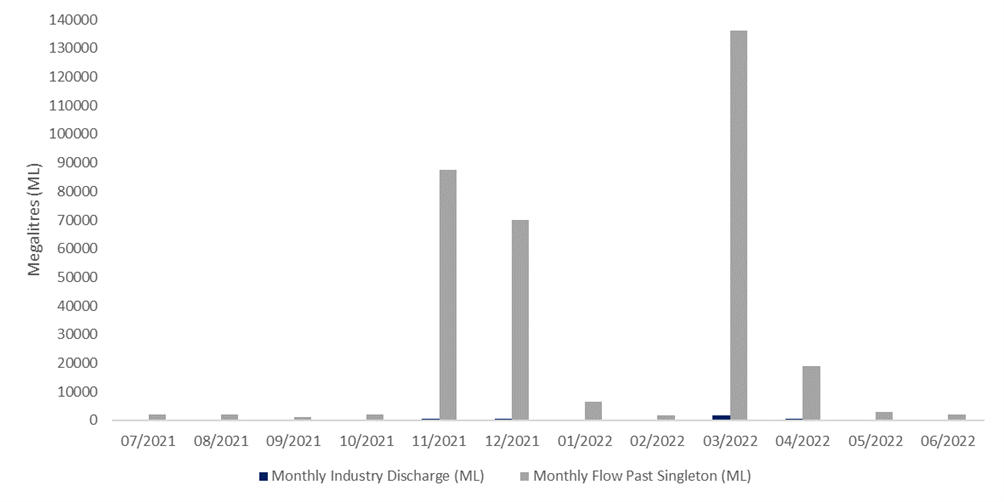
A total of 25,600ML of salt water was discharged into the Hunter River by 10 Scheme participants during the 2021-22 financial year. The total flow of water past Singleton during the 2021-22 financial year was 1,921,450ML.
Industry discharge represented just over 1% of the total volume of water carried past Singleton. A comparison of industry discharge and Hunter River flow volumes is shown below.
Salt discharged and total salt load
A total of 57,300 tonnes of salt was discharged to the Hunter River by 10 Scheme participants during the 2021-22 financial year.
The calculated Total Allowable Discharge (TAD) was 214,500 tonnes, however this does not account for flood flows when participants are not subject to a TAD. The total salt discharged by industry during both high and flood flows represents 27% of the TAD per year.
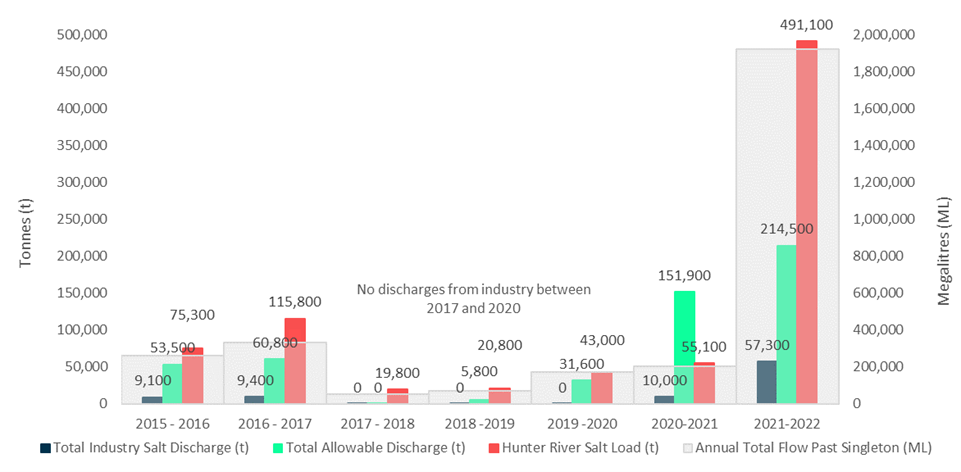
* The TAD for 2021-22 does not include flood flow TAD. Higher figures represented in the 2020-21 data include flood flow TAD.
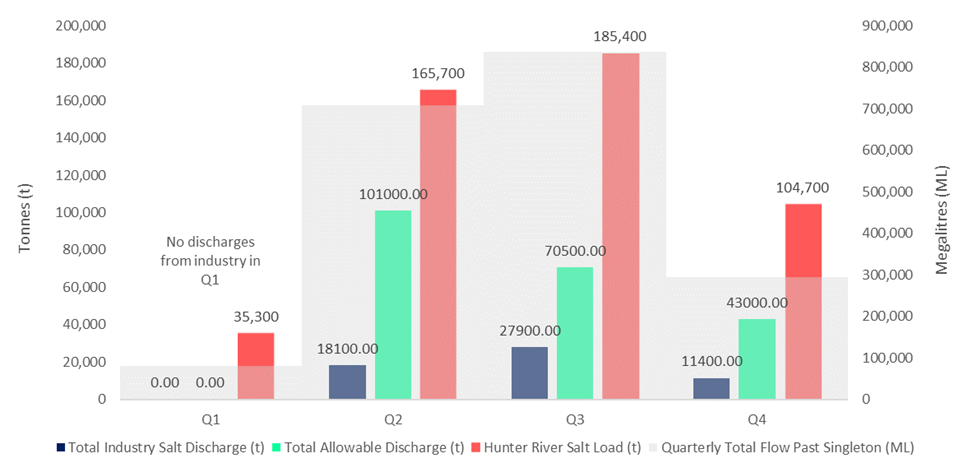
The total salt load carried past the monitoring station at Singleton during 2021–22 was 491,100 tonnes. Higher flow rates due to severe weather conditions, particularly in the second and third quarter resulted in a higher total salt load, as represented in Figure 3 below. Industry discharge represents 12% of the total salt load that flowed past Singleton.
The average yearly electrical conductivity (EC) for each sector is represented in Table 3 below. The upper sector experienced a 7% increase in average EC, while average EC in the middle and lower sectors decreased.
Table 3 Comparison of average annual EC per sector
|
Sector |
Average EC (µS/cm) |
||
|---|---|---|---|
|
2019-20 |
2020-21 |
2021-22 |
|
|
Upper |
520 |
650 |
694 |
|
Middle |
825 |
855 |
722 |
|
Lower |
555 |
742 |
689 |
Though there was a significant increase in total salt load and participant discharges compared to previous years (Figure 2), largely due to higher rainfall, this did not result in a significant increase in average salinity. This demonstrates how the Scheme effectively manages the water quality needs of agricultural users and allows mines and power stations to discharge to the Hunter River catchment.
The salinity target for the upper sector is 600µS/cm during high flows (shown in Figure 4 below as a purple line) and 900µS/cm during flood flows (shown in Figure 4 below as a red line).
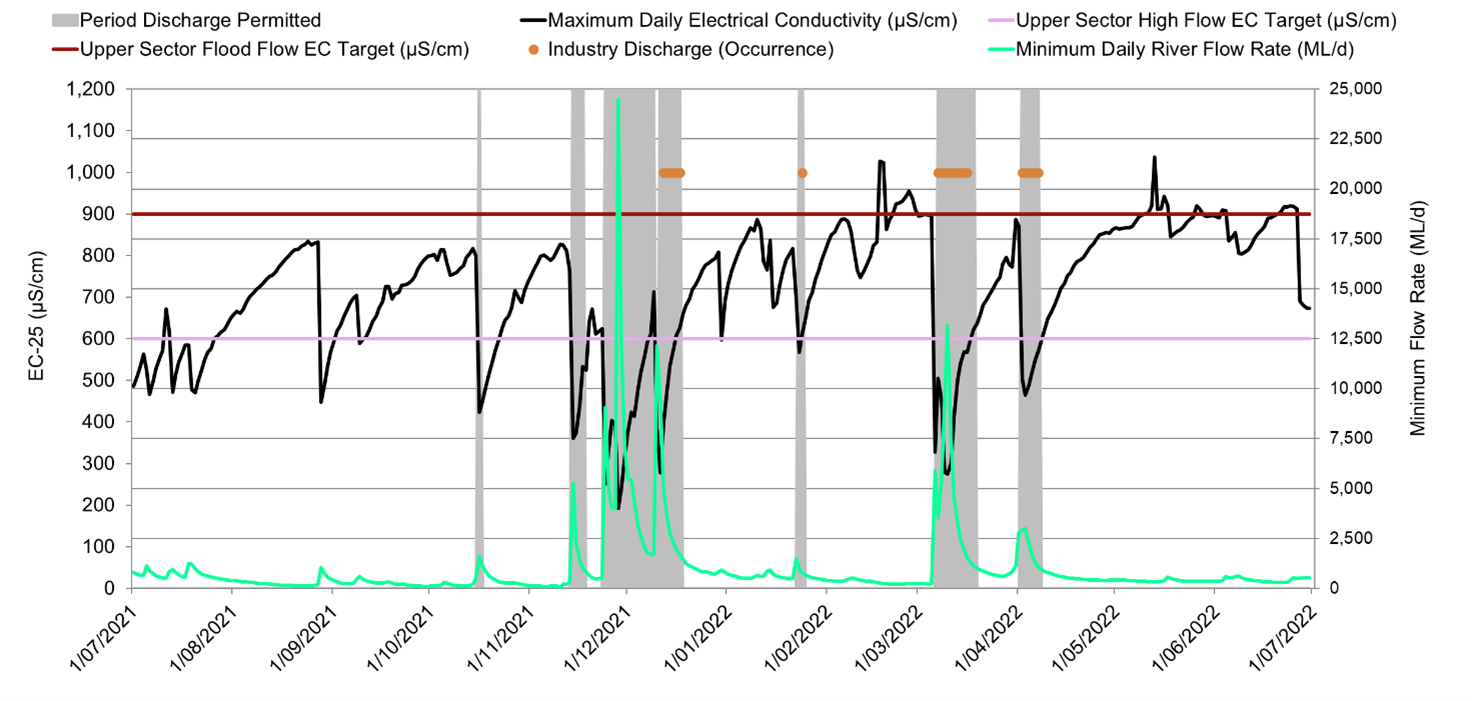
In total, there were 49 opportunities for facilities in the upper sector to discharge within the following timeframes: 14-15 October 2021; 12-16 November 2021; 22 November-16 December 2021; 21-25 January 2022; 5-17 March 2022; 31 March - 6 April 2022.
Average salinity in the upper sector was 694µS/cm for the 2021-22 financial year, 16% above the high flow target of 600µS/cm. The upper sector experienced a total of 286 low flow days, resulting in naturally higher EC, unrelated to industry discharge.
During periods when industry discharged, the upper sector EC remained mostly below 600µS/cm. However, salinity began to rise concurrent with one discharge period in mid-December. This increase is not the result of industry discharge, it is attributed to natural changes in observed flow conditions.
Overall, the Scheme performed well to manage participant discharges in the upper sector and ensure EC levels during discharge events were largely maintained within the target levels. Unexpected high rainfall in the 2021-22 financial year presented on-site water management challenges for participants in the upper sector. This has resulted in discussions with relevant parties which will continue through the 2022-23 financial year.
The salinity target for the middle sector is 900µS/cm for both high flows and flood flows (shown in Figure 5 below as a red line).
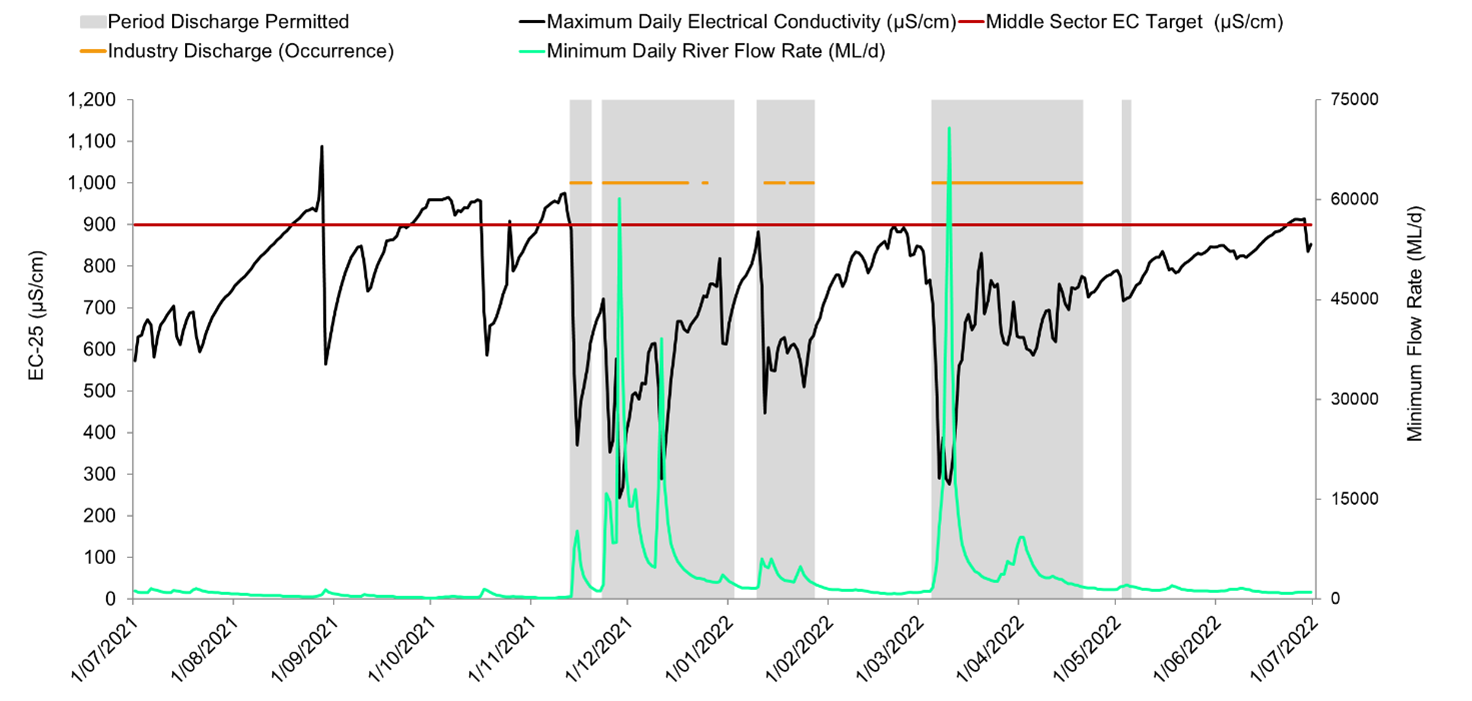
There were 118 opportunities for industries in the middle sector to discharge within the following timeframes: 15-16 October 2021; 12-19 November 2021; 22 November 2021 - 2 January 2022; 9-27 January 2022; 4 March - 20 April 2022; 2-5 May 2022; 17-18 May 2022.
Salinity in the middle sector remained mostly below the sector target of 900µS/cm. Natural rises in EC occurred in Q1 and Q2, outside of industry discharge opportunities. These increases are unrelated to industry discharge and are attributed to low flow periods, resulting in naturally higher salinity. The Scheme performed well during all discharge events with EC in the middle sector remaining below the sector salinity target.
The salinity target for the lower sector is 900µS/cm for both high flows and flood flows (shown in Figure 6 below as a red line).
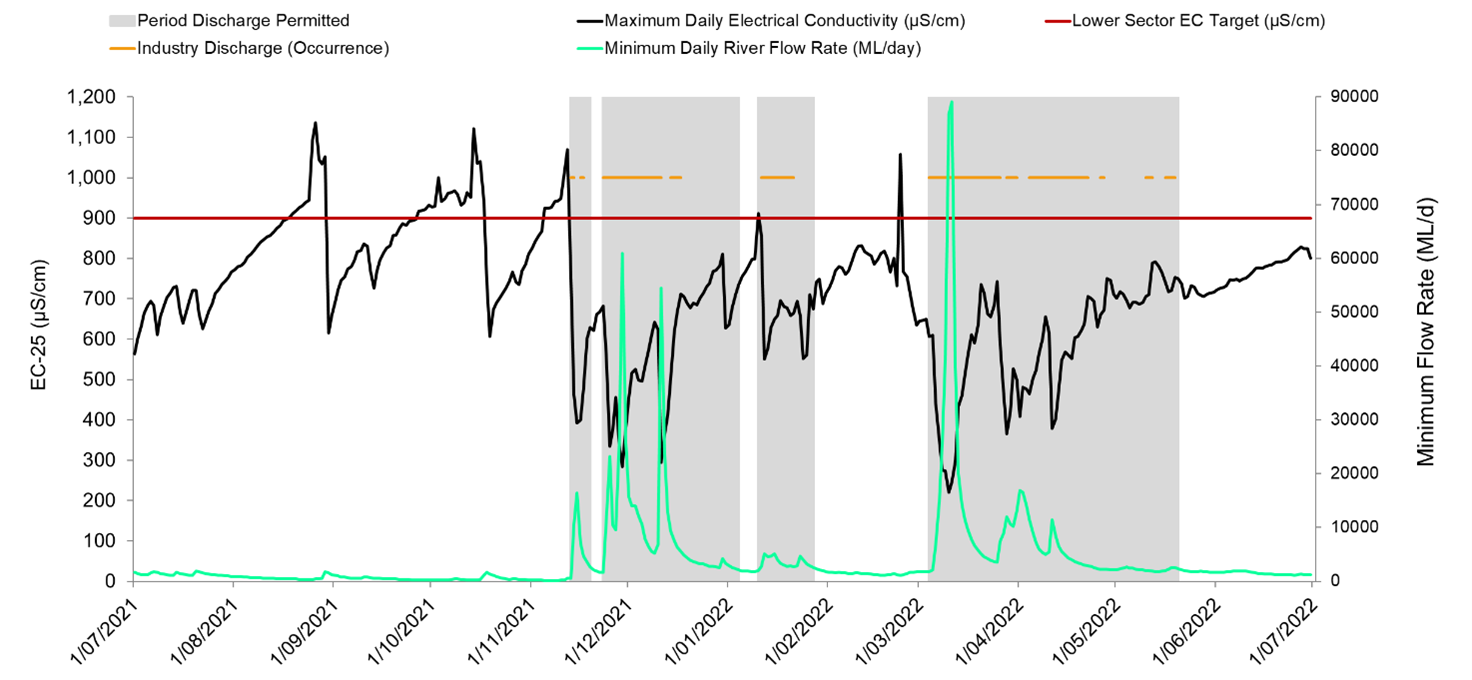
There were 147 opportunities for industries in the lower sector to discharge within the following timeframes: 16 October 2021; 13-19 November 2021; 23 November 2021 - 4 January 2022; 10-27 January 2022; 4 March - 20 May 2022.
EC in the lower sector remained mostly below the target of 900µS/cm. However, increases occurred in August, October and November 2021, and February 2022. Rises occurred outside of industry discharge periods during low flow conditions, causing higher salinity and are not attributed to industry discharge. One increase occurred at the same time as an industry discharge but was the result of changes in observed conditions. This demonstrates that the Scheme managed participant discharges in the lower sector well and EC levels during discharge events remained mostly within the target levels.