
The Sydney Particle Characterisation Study (PDF 11MB) focused on very fine particles (PM2.5), invisible to the human eye, which when inhaled can pass through the throat and nose into the lungs.
The EPA and Office of Environment and Heritage (OEH) commissioned the Australian Nuclear Science and Technology Organisation (ANSTO) to carry out the study. ANSTO analysed PM2.5 data from four sites at Lucas Heights, Richmond, Mascot and Liverpool from 2000-2014.
Types of pollution sources
Sources were analysed based on the types and ratios of chemicals they contained. Some sources just consisted of one factor such as sea salt whereas other sources consisted of more than one factor, for example, smoke and exhaust fumes.
Sources of Sydney air pollution
From 2000-2014, Sydney’s air contained
- fine particles from wood smoke, industry, vehicles, sea salt and soil
- smoke, including from domestic wood burning, that contributed 60% to 80% of fine particles at some sites in winter
- secondary sulfates, due to emissions from coal-fired power stations and industry, that contributed 50%-70% of fine particle pollution in summer at some sites
Findings on particle pollution in Sydney
Particles from cars declined by 40% over the 15 years, but motor vehicles remained a significant source of fine particle pollution. Pollution from vehicles contributed 1.45 μg/m³ or around 23% of total PM2.5 emissions.
- Over the 15-year period, PM2.5 emissions from industry and smoke also declined.
- 85% of PM2.5 pollution was from human activities. Secondary sulfates contributed 24%.
- Natural emissions such as sea salt and dust also contributed to PM2.5 concentrations.
Access the data: Sydney Particle Characterisation Study 2000-2014 (XLSM 9MB)
Categorising particle pollution
The table shows
- ways in which PM2.5 sources were categorised
- the contributions from each source in terms of percentages
Table: Description of air pollution sources in Sydney and percentage of amount they are present from 2000-14
| Description | Major sources | 15 yr av. PM2.5 mass | % |
|---|---|---|---|
| Soil | Fine windblown dust | 0.245 µg/m³ | 4 ± 5% |
| Sea | Sea spray transported from the coast across the sampling sites | 0.507 µg/m³ | 10 ± 11% |
| Mixed - secondary sulfate | Secondary sulfates from coal-fired power stations, oil refineries, motor vehicles and industry | 1.63 µg/m³ | 24 ±16% |
| Mixed - industry - aged secondary sulfate | Industrial sources with components of aged secondary sulfates and sea spray | 0.945 µg/m³ | 15 ± 13% |
| Mixed - smoke, auto |
Smoke from biomass burning, particularly domestic wood heaters in winter, with components of smoke from light, medium and heavy diesel vehicles, particularly at Mascot | 2.08 µg/m³ | 24 ± 20% |
| Auto1 | Primary automobile source | 1.22 µg/m³ | 20 ± 10% |
| Auto 2 | A second minor automobile source, associated with the use of leaded petrol, which ceased early in the study in 2001 | 0.234 µg/m³ | 3 ± 2% |
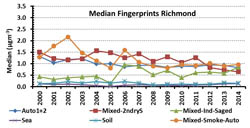
Sources of particle pollution at Richmond from 2000-2014
Using the study results
The study expands evidence available to the EPA for assessing the effectiveness of past policy and will inform the development of new policies and programs to further improve Sydney’s air quality.
OEH is using the data to validate regional particle models which will provide more evidence to support NSW air policy in future years.