
Recreational water quality – beach suitability grades, based on levels of stormwater and sewage contamination being low – is rated as good or very good at 83% of all beaches in NSW and at 97% of ocean beaches. It is lower at around 60% of beaches in the more enclosed waters of coastal lakes and estuaries.
The overall condition of individual waterways is highly variable and generally reflects their level of resilience to change and the level of disturbance locally and across their catchments.
Most coastal, estuarine, and marine systems in NSW have been modified to some extent, and they continue to come under increasing pressure from coastal development. Extensive catchment clearing of more than 80% is evident in around 18% of estuaries. Only about one in five estuaries and coastal lakes retain more than 90% of their natural, uncleared vegetation in those catchment areas that drain directly to the estuary or lake (such waterways are mostly found along the south coast).
Related themes: 14 Protected areas and conservation | 15 Invasive species
NSW indicators
| Indicator and status | Environmental trend |
Information availability |
|
|---|---|---|---|
| Percentage of ocean and estuarine beaches with beach suitability grades for swimming of good or better | Stable | ✔ ✔ ✔ | |
| Frequency of algal blooms | Stable | ✔ ✔ | |
| Distribution of rocky reef-covering biota | Unknown | ✔ | |
| Chlorophyll a levels in estuaries | Stable | ✔ | |
| Turbidity levels in estuaries | Stable | ✔ | |
| Distribution of estuarine macrophytes | Unknown | ✔ | |
| Levels of estuarine catchment disturbance | Increasing impact | ✔ | |
| Rate of sea level rise | Increasing impact | ✔ ✔ ✔ | |
Notes: Terms and symbols used above are defined in About SoE 2015 at the front of the report.
Context
The coastline of NSW is about 1900 km long and the state's marine jurisdiction extends 5.6 km (three nautical miles) out to sea. As well as the mouths and lower reaches of coastal rivers, intermittently closed and open lakes and lagoons are a relatively common estuary type in NSW.
The north coast is generally characterised by broad coastal floodplains that have been extensively cleared and settled. The Sydney Basin is highly urbanised with drowned river valleys cutting through sandstone plateaus. Much of the south coast is less developed and characterised by many coastal lakes and lagoons with relatively small catchments. The coastal, estuarine and marine waters of NSW contain high levels of biodiversity because of their wide range of oceanic, shoreline and estuarine habitats, combined with the strong influence of both subtropical and temperate currents.
These varied environments provide many important ecosystem services, such as preventing coastal and seabed erosion, maintaining coastal water quality, and acting as critical habitats for fish and other marine life. The community values and uses provided by the NSW marine environment include healthy aquatic ecosystems, recreation, visual amenity and aquatic food production.
The desirability of coastal lifestyles and increasing settlement along the coast are placing estuaries and coastal lakes under ever greater levels of stress. The waters and ecosystems adjacent to urban and industrial areas are particularly exposed to the effects of pollution from urban runoff, stormwater and sewage discharge. The attendant pressures of development and urbanisation, and disturbance of the natural values of surrounding catchments need to be carefully managed to protect the health and preserve the condition of estuarine environments.
Systematic data has generally been lacking on the overall condition and long-term health of the coastal, estuarine and marine areas of NSW, along with the important ecosystems they support. However, considerable data has been collected over several decades on estuarine physical characteristics, which are essential for interpretation of estuary condition.
Status and trends
Water quality
The health of coastal, estuarine and marine ecosystems and the food webs they support is heavily influenced by water quality. While water quality is naturally variable across different estuaries, pressures on it over time can lead to a reduction in ecosystem health, including changes in the distribution and abundance of species, loss of biodiversity, and reduced recreational value and amenity.
Marine waters are generally considered to be in good condition as currents, wave action and tides are usually able to dilute and transport pollution (depending on the relative volume of the receiving water body). This makes marine systems less vulnerable to degradation, compared with estuaries and coastal lakes (especially those that are only intermittently open to the sea), where lower levels of dilution and tidal flushing have a reduced capacity to ameliorate pollution inflows.
Even in well-flushed systems, sedimentation and local pollution from stormwater runoff associated with urban and industrial development and sewage system overflows can have an impact on water quality. Pollutants can accumulate in sediments, and bioaccumulation in the food web can then lead to adverse effects on ecosystems and human health.
The Australian and New Zealand Guidelines for Fresh and Marine Water Quality (ANZECC & ARMCANZ 2000) specify a wide range of criteria for physical, chemical and biological factors for water quality. Of these, bacteriological contamination is used as a broad, general indicator of the impacts of human activities on the health of coastal, estuarine and marine waters.
Recreational water quality
High rainfall causing stormwater discharges and sewage overflows is recognised as the principal factor in the contamination of water at NSW beaches. The Beachwatch programs monitor recreational water quality at swimming beaches in NSW. While not an assessment of overall water quality and waterway health, the results from both programs provide information on the risks of sewage and stormwater pollution at beaches. This indicates the fitness of water bodies for human recreational use, as well as the effectiveness of stormwater management.
Beachwatch & Harbourwatch – conducted by OEH – monitors 129 swimming sites in the Sydney, Hunter and Illawarra regions (72 ocean beaches and 55 estuarine beaches and two lagoon/lake sites). Under the Beachwatch Partnership Program, regional coastal councils also monitor beaches in their areas. In the 2013–14 swimming season, 11 local councils participated in this program, which monitored 120 swimming sites, including beaches, coastal lagoons, ocean baths, estuaries and rivers.
Swimming sites are assigned a beach suitability grade, ranging from 'very good' to 'very poor'. These relate to the Microbial Assessment Category (MAC), determined in accordance with the Guidelines for Managing Risks in Recreational Water (NHMRC 2008) (a new standard adopted by the Beachwatch programs in 2009). In 2013–14, 83% of the 249 swimming locations monitored were graded as 'very good' or 'good'. Reflecting the lower capability of these systems to dilute and flush pollution, only 41% of lake/lagoon swimming sites and one of the two ocean baths were graded as 'very good' or 'good'. However, 71% of estuarine beaches achieved these ratings, as did nearly all ocean beaches (97%) (Map 20.1).
Map 20.1: Beach suitability grades at coastal and estuarine swimming sites in NSW, 2013–14
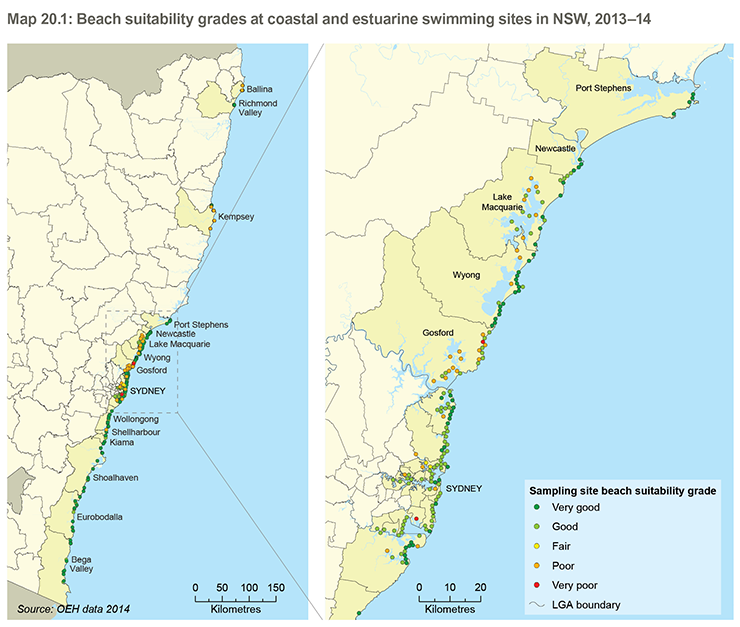
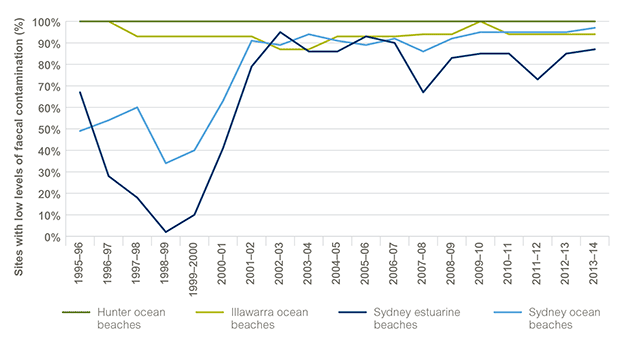
Figure 20.1 shows the proportion of sites with only low levels of faecal contamination over the past 19 years at ocean and estuarine beaches in the greater Sydney area. Before about 2002, wet weather had a much greater impact on swimming locations in Sydney. As a comparison, during 1998–99, almost as much rain fell as in 2007–08 and 2010–11; however, in 2010–11, 85% of estuarine swimming sites recorded low levels of enterococci (MAC A or B) while reprocessing the 1998–99 data for this new assessment system gives a result of only 2%.
Overall, these are strong results, with significant reductions in bacterial levels at swimming locations in the Sydney region arising from improvements in stormwater and wastewater management over the past decade. Nevertheless, the results for recent years continue to indicate the need to improve the management of stormwater inflows to estuaries in urban catchments.
Detailed results for all swimming sites monitored in NSW can be found in the State of the Beaches reports (OEH 2014).
Figure 20.1: Percentage of Sydney, Hunter and Illawarra beach and estuary monitoring sites graded as having low levels of faecal contamination, 1995–96 to 2013–14
Source: OEH data 2014
Notes: Beach suitability grades are only available from 2009–10 onwards. To report on trends through time, Microbial Assessment Categories have been back-calculated using historical enterococci data. Microbial Assessment Categories A and B indicate generally low levels of faecal contamination and are required for a swimming site to achieve a 'very good' or 'good' beach suitability grade.
Data from the Beachwatch Partnership Program is not included.
Data for Figure 20.1 (XLSX 18KB)
Eutrophication
Catchment disturbance (e.g. soil erosion) together with urban, industrial, and effluent discharges, can add nutrients and particles to waterways. These are conditions that can skew aquatic biodiversity towards algae and other simple aquatic organisms. Eutrophication occurs as water clarity drops and nutrients and organic matter accumulate. This results in aquatic plants and animals struggling to get the light and oxygen they need to grow. Some algal species may produce toxins that have serious implications for fish, shellfish and humans coming into contact with the water.
Abnormally high turbidity (low water clarity) or high levels of chlorophyll a (indicative of high phytoplankton levels or algal blooms) can signal that a water body is experiencing eutrophication. Sometimes this can be attributed to natural causes, but often it is human-induced. Ocean upwellings, which have a close association with El Niño cycles, can lead to natural blooms.
As part of the NSW Natural Resources Monitoring, Evaluation and Reporting Strategy (MER Strategy) (DECCW 2010b), trigger values and compliance intervals for turbidity and chlorophyll a were derived (see Roper et al. 2011) using an approach consistent with the Australian and New Zealand Guidelines for Fresh and Marine Water Quality (ANZECC & ARMCANZ 2000). Exceeding the guidelines' trigger levels does not automatically indicate that estuarine conditions are poor, but any pattern of exceedances is regarded as a cue for further investigation to determine whether water quality issues exist.
Turbidity and chlorophyll a: Data on estuarine turbidity and chlorophyll a are available from July 2008 to March 2014. These data were categorised into six estuary types Roper et al. 2011 and report card grades, which incorporate both magnitude and frequency of non-compliance with the NSW estuary specific trigger values (OEH 2013a). Report card scores are A (very good), B, C, D, F (very poor).
The results (Tables 20.1 and 20.2) indicate that in general the majority of all estuary types are in at least good condition, but that back dune lagoons and creeks are most likely to suffer from high turbidity when disturbed and drowned river valleys and barrier rivers and to some extent. Creeks are most likely to have poor scores for chlorophyll.
Algal blooms (offshore): Satellite data has been used for the broad and systematic assessment of the frequency and type of blooms in coastal and marine waters. This has shown that overall, the frequency of algal blooms appears to be relatively stable (see Algal blooms in SoE 2012 (EPA 2012)). ANZECC trigger values for offshore waters are currently being reviewed to account for smaller scale variations along the shelf of NSW.
Table 20.1: Turbidity – Percentage of estuaries that attained each grade
| Water quality grade | |||||
|---|---|---|---|---|---|
| A | B | C | D | F | |
| Barrier river | 10 | 49 | 31 | 8 | 2 |
| Back dune lagoon | 19 | 31 | 31 | 6 | 12 |
| Lagoon type B (creek) | 5 | 23 | 31 | 31 | 0 |
| Drowned river valley | 14 | 42 | 42 | 0 | 0 |
| Lagoon type A (lagoon) | 35 | 30 | 22 | 9 | 4 |
| Lake | 37 | 21 | 26 | 15 | 0 |
Source: Roper et al. 2011; OEH 2013a
Table 20.2: Chlorophyll a – Percentage of estuaries that attained each grade
| Water quality grade | |||||
|---|---|---|---|---|---|
| A | B | C | D | F | |
| Barrier river | 15 | 36 | 31 | 15 | 3 |
| Back dune lagoon | 38 | 44 | 19 | 0 | 6 |
| Lagoon type B (creek) | 19 | 23 | 42 | 8 | 8 |
| Drowned river valley | 14 | 28 | 14 | 28 | 14 |
| Lagoon type A (lagoon) | 30 | 30 | 34 | 4 | 0 |
| Lake | 15 | 37 | 42 | 5 | 0 |
Source: Roper et al. 2011; OEH 2013a
Ecosystem health
Aquatic vegetation along the NSW coast falls into two broad categories: biota attached to rocky features (reefs, headlands, etc.) and plants rooted in sediments (mostly the estuarine macrophytes: seagrass, mangroves and saltmarsh). Coastal vegetation, such as dune, coastal heath and woodland, and back-beach swamp ecosystems, are important for the overall health of coastal environments.
Systematic, ongoing monitoring of these communities has not occurred, with the most recent major studies reported in SoE 2012 (summarised in Table 20.3).
Table 20.3: Changes in rocky reef biota and macrophyte distribution
| Rocky reef biota | Seagrass | Mangroves | Saltmarsh |
|---|---|---|---|
| These macrophyte communities have an important role in maintaining sediment stability and water quality, and they provide shelter and food to a wide variety of aquatic biota. | |||
| Whilst selected biota (such as specific species of seaweed) have been found to have increased or reduced abundance relative to the size of local human populations, overall there appears to be no significant association between human population level and either condition or patterns of change in condition. | Four estuaries account for more than 60% of the total area of seagrass in NSW.
Causes of seagrass decline include:
The overall decline in the extent of seagrasses for the whole coast since European settlement has been estimated at less than 30%, but with many major estuaries, the loss is as much as 85%. Recent surveys indicate ongoing losses tend to be small and may relate to localised climatic events, such as high rainfall and flooding rather than direct human impacts. |
Three major estuaries – Port Stephens and the Hunter and Hawkesbury rivers – account for approximately 50% of the total distribution of mangroves in NSW.
Similar to seagrasses, the loss of mangroves has been estimated at between 30% and 70%. Mangroves are, however, quite resilient and are able to rapidly colonise favourable areas. In more than two dozen estuaries, mangrove forests have been found to be expanding. This may be due to the recolonisation of previously cleared areas, expansion into areas of saltmarsh, or colonisation of sediment banks and locations with altered hydrologic regimes. |
There has been a substantial decline in the extent of saltmarsh since European settlement, estimated to be 30% to 70%. Recent surveys indicate ongoing losses tend to be small.
Causes of saltmarsh decline include:
Losses of saltmarsh have been particularly severe in the Sydney region and on the central coast. Saltmarsh has been listed as an endangered ecological community in NSW due to the nature of ongoing losses. |
Source: EPA 2012
Threatened species
Information on the status of marine species is generally not as good as that for terrestrial species. However, 41 marine species and one marine population are currently listed as threatened, including some presumed extinct, in the Fisheries Management Act 1994 (FM Act) and Threatened Species Conservation Act 1995 (TSC Act)
- marine seabirds (19 species)
- marine mammals (7 species)
- fish (6 species)
- reptiles (3 species)
- marine invertebrates (4 species)
- macroalgae (2 species)
- marine vegetation (1 species, 6 populations).
These listings can be expected to change over time, with the number of species listed potentially growing as pressures on the marine environment increase. Higher order species, such as sharks, tuna and whales, remain the most vulnerable to external pressures (see 'Pressures' section).
Pressures
Population and demographic change
The majority of the NSW population lives close to the coast; in 2014, two thirds of the estimated resident population of NSW resided in the coastal councils. This proportion is rising due to the stronger population growth in the Greater Metropolitan Region (GMR2), and because internal population migration is dominated by migration to coastal areas rather than inland areas (see Theme 1: Population for more details).
The average population density is greater than 40 people per km2 in coastal catchments, greater than 200 people per km2 in estuarine catchments, and more than 5000 people per km2 in Port Jackson and Dee Why catchments. These population patterns place considerable pressure on coastal and estuarine ecosystems through increased development and disturbance of the catchments.
Catchment disturbance
Disturbances across catchments can include:
- changes to estuarine habitats, water quality and estuarine processes due to the removal of aquatic vegetation, introduction of new biota, waterway engineering (e.g. land reclamation, hard erosion control structures, weirs, training walls and artificial entrance openings), building works (e.g. marinas and boat ramps), fishing/trawling, and aquaculture developments
- disruption or modification of the riparian and foreshore zones, which are particularly important as barriers and filters protecting the water body and minimising erosion (pressures originating in this area are likely to have a more direct impact on estuary condition than the same pressure acting further away)
- further away from the water, changes in land use and the removal of vegetation, leading to increased loads of diffuse source nutrients and sediments, and pollutants (this can be a less immediate impact on estuary condition, but the cumulative impact from the large areas involved can be significant).
Systematic, ongoing monitoring of the condition of and disturbances to waterway riparian and catchment areas has not occurred. Recent major studies were reported in SoE 2012. Surveys tend to be conducted once, for example, land use, but need to be repeated at regular intervals to monitor change and any associated increase in pressure.
A key finding was that 71 (or more than a third) of NSW estuaries have catchment clearing rates of less than 20%. Of those 71, about half have less than 7.5% clearing. At the other end of the spectrum, 19 or about 10% of estuaries have clearing rates of more than 80% (Roper et al. 2011). These results indicate the relatively undeveloped nature of large parts of the NSW coast and the concentration of population within a discrete number of major urban centres. This variability is seen as a key strength in population patterns that should be protected.
A second observation is that the degree of clearing tends to increase further down a catchment. This is generally the part of the catchment that drains directly to the estuary (with nearly one in five estuaries having clearing rates greater than 80% in the direct drainage zone). Many of these estuaries are considered to be in a fair to poor state, particularly the smaller systems with intermittent connections to the ocean. Larger, or better-flushed, estuaries that have been extensively cleared were generally assessed to be in better condition.
Similar patterns of disturbance were found in riparian areas in that it is focused more on urban areas, but with some distinct differences. The extent of riparian disturbance generally reflects that part of the catchment draining directly into the estuary; however, the correlation is not as good with the fluvial catchment that drains areas above the tidal limit. For some catchments, the overall catchment clearing can be relatively low but the riparian clearance is high, reflecting development concentrated around an estuary. In non-urban areas, waterway disturbance had a tendency to relate to aquaculture (especially along the south coast).
Nutrient and sediment loads
Sediment and nutrient loads from land-use changes and land management practices were modelled (see Roper et al. 2011) and combined with data from the NSW Environment Protection Authority (EPA) licensing system (primarily point source discharges from sewage treatment plants) to give estimated annual loads for total suspended solids (TSS), total nitrogen (TN) and total phosphorus (TP).
This analysis reveals that, compared to natural levels, more than half of NSW estuaries are estimated to have experienced a doubling (or greater) of loads of TSS. For nutrients, nearly half of NSW estuaries have experienced a doubling (or greater) of TN levels, and nearly three in four estuaries have experience doubling (or greater) of TP levels (see SoE 2012 for details). As licensed discharges have been relatively stable, these variations have been driven more by broadscale catchment changes.
Part of these material inputs to estuaries are carried out to sea. This is estimated to be an average of around 23,000 tonnes of nitrogen, 2500 tonnes of phosphorus and 835,000 tonnes of sediment per year from 184 estuaries (Roper et al. 2011).
Direct discharge of nutrients, sediments, metals, toxins, and other chemicals and pollutants into coastal waters also occurs from the many small catchments that front the coast. This often involves untreated urban stormwater runoff in developed areas, as well as licensed discharges from industry, e.g. minerals production and refining, and sewage treatment plants.
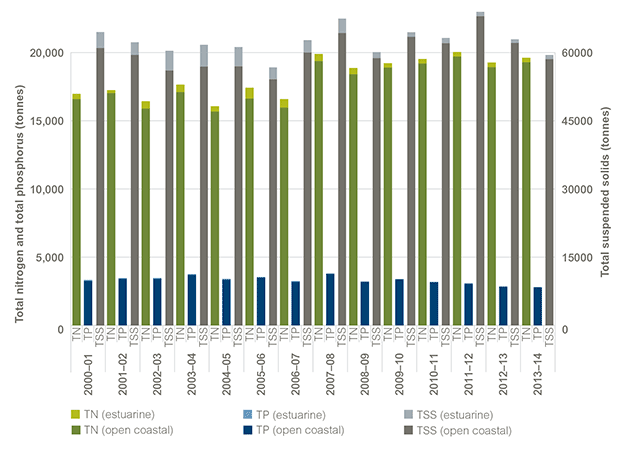
Figure 20.2 shows licensed discharges of total nitrogen, total phosphorus and TSS to open marine waters and estuaries. Discharges to estuarine environments have been decreasing over the period shown. Licensed discharges of nitrogen to the marine environment have increased by about 1% per year, whereas phosphorus has been decreasing by about 1% per year. Discharges of suspended solids tend to reflect wet and dry periods (such as El Niño cycles), but have been relatively stable overall.
Licensed discharges of suspended solids to the marine environment represent less than 7% of the total received by the coastal, estuarine and marine environment. Also, except for Sydney and Wollongong coastal waters (and a few of the smaller north coast estuaries), diffuse source discharges to the marine environment are more significant contributors of nutrients to marine waters than are point source discharges.
Figure 20.2: Licensed discharges to NSW open marine waters and estuaries, 2000–01 to 2012–13
Source: EPA data 2015
Notes: Data covers all licensees discharging into the marine environment under the load-based licensing scheme.
Data for Figure 20.2
Other pollution and refuse
Additional sources of coastal and marine pollutants include:
- garbage washed or blown from land
- discarded fishing gear (both commercial and recreational)
- material from shipping operations and incidents, such as ballast water discharges and sewage released from vessels, and oil or chemical spills.
No major shipping-related pollution incidents have been recorded in NSW marine waters over the last three years.
Entanglement and ingestion of such debris can be fatal to marine species, particularly threatened species, such as seabirds, turtles and whales. The Australian Government Environment Protection and Biodiversity Conservation Act 1999 lists 'Injury and fatality to vertebrate marine life caused by ingestion of, or entanglement in, harmful marine debris' as a key threatening process. Recovery in the populations of threatened species, such as humpback whales, is likely to result in a greater number of accidental entanglements.
As much debris is plastic, which both floats and is slow to degrade, the impacts can be multiple and long-lasting. This issue was a specific focus of World Oceans Day 2015 in Australia.
Fishing
Commercial and recreational fishing occurs in the coastal, estuarine and marine waters of NSW. Commercial fish catch data available for estuaries indicates fishing is conducted in a total of 57 estuaries with over half the total fish catch of 4800 tonnes coming from five estuaries. In decreasing order of catch size, these are Clarence River, Wallis Lake, Hawkesbury River, Port Stephens and the Myall River system.
Commercial and recreational fishing place pressures on the fisheries they target as well as other biodiversity and the broader environment. Impacts from fishing and trawling can include damage to habitat (by gear catching on the submerged reefs, dragging of nets across seagrass beds, etc.), bycatch, waste (see above), and demand on infrastructure.
Under the FM Act, hook and line fishing in areas important for the survival of threatened fish species is listed as a key threatening process. The current shark meshing program in NSW waters is also listed as a key threatening process under both the FM Act and the TSC Act.
Invasive species
The introduction of non-indigenous fish and marine vegetation to the coastal waters of NSW is listed as a key threatening process under the FM Act. Marine invasive species are plants or animals – often introduced from overseas – that can have a significant impact on marine industries and the environment, by taking over habitats and directly competing with native species for food. Marine pests include mussels, crabs, seaweeds, sea stars and other marine species. Some marine pests are native to other regions of Australia but have been transported into NSW through shipping or the aquarium trade (see also Theme 15: Invasive species).
Climate change
Both the FM Act and TSC Act list human-induced climate change as a key threatening process.
The potential impacts of climate change on coastal, estuarine and marine environments are not well understood. Predicted increases in sea surface temperature and ocean acidification, however, are likely to have significant impacts, as is increased flooding from more frequent and more intense east coast lows, along with increased coastal inundation from sea level rise.
Sea surface temperature and salinity
Over the past 40 years, average sea surface temperatures in NSW coastal waters have increased by 0.5°C in the north of the state and up to 0.8°C in the south (OEH 2011). Temperatures in the Tasman Sea off the east coast of NSW have risen markedly. Climate change predictions for NSW include higher sea surface temperatures (potentially by up to 4°C), more frequent storms and stronger currents (Hobday & Lough 2011). Changes to currents, regional wind patterns and mixed layer depths are also likely to affect upwellings, with an associated impact on primary productivity (Hobday et al. 2006).
To illustrate this, the east Australian current now extends 350 km further south, making southern waters warmer and saltier than previously (Ridgway 2007). An observed impact of this change has been the spread of the black spiny sea urchin from NSW into Tasmania, where it was not previously found. The urchin is a voracious predator of important algal species and threatens fisheries (Ling et al. 2009). In addition, it has been found that 45 species of fish have changed their distribution in south-eastern Australia over recent years, with the change corresponding to warming observed in the marine environment (Last et al. 2010).
Marine acidification
The world's oceans currently absorb about 25% of the carbon dioxide (CO2) generated by humans, with about 40% of this absorbed in the Southern Ocean (CSIRO & BoM 2010). The CO2 absorbed by the ocean increases its acidity, which is registered as a decrease in pH. Since 1870 the marine waters of the Australian region have experienced a pH decrease of 0.09 (Lenton et al. 2015).
Any measurable change in pH is significant and has a potential impact on the marine environment. Ocean acidification will decrease the ability of calcitic organisms such as molluscs to form shells and corals (Fabry et al. 2008; CSIRO & BoM 2010). Organisms that secrete calcite in its more soluble form of aragonite are particularly susceptible.
Since these organisms play an important role in food webs and the natural cycling of carbon, this will have far-reaching implications for the future health of ocean ecosystems. These effects are now being observed in the Southern Ocean, and a measureable decrease in the aragonite saturation state has been observed in the Australian region (Lenton et al. 2015).
Sea level rise and coastal inundation
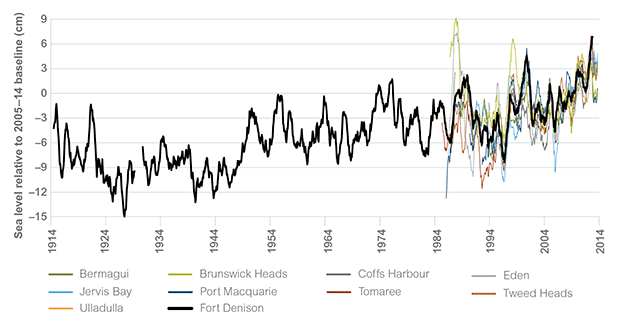
Variations in climate and sea level are inextricably linked (BoM 2011). Warming temperatures lead to sea level rise for two main reasons: water expands as it warms and, as average temperatures rise, land-based ice sheets begin to melt (IPCC 2007). Whilst sea level rise is not uniform across the world or around Australia (due to regional climatic cycles such as El Niño – Southern Oscillation and the Indian Ocean Dipole and movements in the land from uplift or subsidence), Australian mean sea level trends are broadly consistent with average global trends from 1966 to 2010. This includes an increase in the rate of rise in the early 1990s (White et al. 2014). Allowing for differences characteristic of physical movement of ocean currents and weather systems, sea level rise at monitoring stations along the NSW coast shows common trends (Figure 20.3), and has generally increased by about 1 mm per year (at Fort Denison, the average rate has been 0.9 mm per year from 1914 to 2006) (Couriel et al. 2014).
Sea level rise is virtually certain to increase the extent or height of tidal levels, enlarging the areas of low-lying land near coastal waterways that are exposed to tidal inundation (DECCW 2010a). Due to the combined influence of sea level rise and higher rainfall events, the frequency, height and extent of floods are expected to increase in the lower parts of coastal floodplains (DECCW 2010a). With over 80% of the NSW population living in the coastal strip (see Theme 1: Population for more details), rising sea levels are likely to have a significant effect on human settlements in coastal NSW.
Most coastal dunes and some beach-barrier systems and estuaries are expected to be affected by an increased threat of erosion from a combination of sea level rise, changes in wave direction, and greater storm intensity. A number of sites along the NSW coast have already experienced additional coastal erosion (DECCW 2010a).
Figure 20.3: Monthly average sea levels along the NSW coast, 1914 to 2014
Source: Couriel et al. 2014; Manly Hydraulics Laboratory data as at July 2015
Notes: These monthly water level trends for NSW tide gauges are based on rolling 12-month averages. Levels for all stations are normalised so the average water level for 2005–2014 is zero. In addition, tide-gauge data has been indexed relative to Fort Denison (Sydney Harbour).
Graph (from Couriel et al. 2014) has been updated with more recent, quality-controlled, data from the Manly Hydraulics Laboratory. Rolling 12-month averages with fewer than nine months of data have been excluded.
Data for Figure 20.3
The effect of rising sea levels on natural systems is demonstrated by mangrove swamps encroaching on areas previously occupied by saltmarsh. In 70% of estuaries surveyed in Queensland, NSW, Victoria and South Australia, the area of saltmarsh taken over by mangroves has been greater than 30% and in some cases mangroves have completely replaced saltmarsh. This change has largely been attributed to a combination of localised land subsidence and sea level rise (Saintilan & Williams 1999; Saintilan & Williams 2000; Rogers et al. 2006). As water levels rise, the ability of some communities, such as saltmarsh, to colonise new areas at more suitable elevations may be impeded by the presence of coastal development (Goudkamp & Chin 2006). This phenomenon has been called 'coastal squeeze'.
Other pressures
A range of other pressures also affect waterway health, but their cumulative impact is more difficult to measure or assess. Tidal flows within estuaries may be directly affected by rock training walls designed to keep estuary entrances open, the artificial opening of lagoon entrances to alleviate flooding and water quality concerns, and other flood mitigation structures.
Changes to catchment hydrology can occur with land developments which increase the volume and frequency of freshwater flows entering estuaries. Conversely, inputs can decrease with upstream water storages, extraction of water for agriculture, and barriers such as weirs. Cumulatively, hydrology changes can have a significant impact on water levels, tidal and mangrove limits, salinity and nutrient concentrations, along with the distribution and composition of estuarine ecosystems.
Responses
Legislation
The NSW Coastal Policy 1997 (NSW Government 1997) and Coastal Protection Act 1979 provide the strategic direction and legislative framework for managing the NSW coastal zone, including the requirement for coastal zone management plans (see below).
The Environmental Planning and Assessment Act 1979 sets the framework for land-use planning decisions. It is complemented by state environmental planning policies (SEPPs) that address planning issues relevant to the coastal zone:
- SEPP No 71 – Coastal Protection, which ensures that: development in the NSW coastal zone is appropriate and suitably located; there is a consistent and strategic approach to coastal planning and management; there is a clear framework for assessing development in the coastal zone.
- SEPP No 14 – Coastal Wetlands ensures that coastal wetlands are preserved and protected for environmental and economic reasons.
- Other SEPPs relevant to coastal development include: SEPP No 26 – Littoral Rainforests; SEPP No. 50 – Canal Estate Development; SEPP No. 62 – Sustainable Aquaculture.
The Protection of the Environment Operations Act 1997 regulates point source discharges into coastal, estuarine and marine environments, and regulates discharges of oil and other noxious substances from ships.
The Marine Estate Management Act 2014 (MEM Act) provides for the strategic and integrated management of the whole marine estate – our marine waters, coasts and estuaries (see also Theme 14: Protected areas and conservation). The new Act, which repeals the Marine Parks Act 1997 and the aquatic reserves division of the Fisheries Management Act 1994 (FM Act), provides for a comprehensive system of marine parks and reserves. It also provides a statutory base for the Marine Estate Management Authority and the Marine Estate Expert Knowledge Panel.
The MEM Act also mandates an environmental, social and economic threat and risk assessment (TARA) to be undertaken for the entire NSW marine estate, including coastal waters, lakes and lagoons, estuaries and coastal wetlands. The outcomes of the TARA will directly inform the development of a marine estate management strategy that will identify priority management actions and set cross-agency policy direction for managing the marine estate as a single continuous system. Both the TARA and the marine estate management strategy are currently under development and will be completed in 2015–16.
To this end, a Threat and Risk Assessment Framework (MEMA 2015) was published in April 2015. This key policy document sets out how threats and risks to the environmental, economic and social benefits derived from the NSW marine environment will be assessed and prioritised. This assessment will support the development of management responses to the most important threats.
The FM Act and supporting regulations provide for conservation of fish stocks, key fish habitats, threatened species, populations and ecological communities of fish and marine vegetation.
Policies and programs
Complementing the regulatory regime, NSW is developing and implementing a range of polices, programs, and other activities.
AdaptNSW: The NSW Government AdaptNSW program is developing information and tools to help government, businesses and communities build resilience in the face of future extreme events and hazards.
Management of water quality: The main responses aimed specifically at improving estuarine water quality by reducing pollution include:
- setting Marine Water Quality Objectives for NSW Ocean Waters (DEC 2005) – these describe the water quality needed to protect the community's values for, and uses of, the marine environment. They simplify and streamline the consideration of water quality in coastal planning and management planning strategies covering land use and catchment management, which set water quality objectives
- developing the NSW Diffuse Source Water Pollution Strategy (DECC 2009) – this recognises that diffuse source pollution accounts for the majority of the pollution load in NSW waterways, and it aims to coordinate the NSW Government's approach to manage these issues.
Coastal zone and estuary management plans: These plans are being prepared and implemented by local councils for about half of the state's 184 estuaries in order to achieve integrated, balanced and ecologically sustainable management. The Guidelines for Preparing Coastal Zone Management Plans (OEH 2013b) provide advice to local councils, their consultants and coastal communities on the preparation of coastal zone management plans. The primary purpose of these plans is to address priority management issues in the coastal zone including:
- managing risks to public safety and built assets
- pressures on coastal ecosystems
- community uses of the coastal zone.
Plans for estuaries should include:
- a description of the condition of estuaries within the plan's area
- details of the pressures affecting estuary condition and their relative magnitude
- proposed actions to respond to pressures on estuary condition
- an entrance management strategy for intermittently closed and open lakes and lagoons
- an estuarine monitoring program.
Coastal reforms: The NSW Government has committed to continuing its coastal reform agenda. Three new elements of the reforms are being planned, which include:
- replacing the current legislation with new coastal management legislation – a proposed new coastal management Act
- new arrangements to better support council decision-making, including a decision support framework, a new coastal management manual, and improved technical advice
- more sustainable arrangements for funding and financing coastal management activities.
Public exhibition of a draft exposure Bill of the proposed new coastal management Act is scheduled for late-2015.
Regional plans: These set a strategic direction for selected, rapidly growing, coastal regions (see Theme 1: Population for more details).
Catchment action plans: These are being implemented by local land services and represent the key process that coordinates and drives natural resource management at the regional level.
Australian Government activities
Under the National Water Quality Management Strategy (NWQMS), management plans are being developed and implemented for estuaries, coastal waters, and other water bodies. These plans use the NWQMS to protect agreed environmental values. A particular focus is on coastal pollution hotspots around the country. The Great Lakes (Wallis, Smiths and Myall Lakes), Botany Bay, and the Hunter River estuary and its catchment have been identified as hotspots in NSW.
Future opportunities
NSW will need to continue to develop and implement suitable management and adaptation strategies to prevent a decline in the quality of coastal, estuarine and marine environments. The poor condition of water quality in some highly urbanised estuaries suggests that stormwater runoff and new urban development can be managed better to maintain the health of estuaries and coastal lakes and the desirability of coastal lifestyles.
Vulnerability to inundation and coastal erosion should be a significant consideration in the location and planning of all future settlements in catering for an expanding population and development needs.
Areas of further improvement could include:
- collaboration between the community, local, state and national governments and research institutions to make the most efficient use of available resources
- strengthening comprehensive ecosystem health monitoring programs to provide sound scientific input to decision-making
- further development and expansion of risk assessment methods to help protect and rehabilitate the environment in the most resource efficient manner.
References
ANZECC & ARMCANZ 2000, Australian and New Zealand Guidelines for Fresh and Marine Water Quality, Australian and New Zealand Environment and Conservation Council and Agriculture and Resource Management Council of Australia and New Zealand, Canberra [www.environment.gov.au/water/publications/quality/nwqms-guidelines-4-vol1.html] Cited in: Ch 20(1); Ch 20(2); Ch 17
BoM 2011, The Australian Baseline Sea Level Monitoring Project: Annual sea level data summary report July 2010–June 2011, National Tidal Data Centre, Australian Bureau of Meteorology, Canberra [www.bom.gov.au/ntc/IDO60202/IDO60202.2011.pdf] Cited in: Ch 20
Couriel, E, Modra, B & Jacobs, R 2014, 'NSW Sea Level Trends – The Ups and Downs', paper presented to the 17th Australian Hydrographers Association Conference, 28–31 October 2014, Sydney [https://new.mhl.nsw.gov.au/docs/tide/AHA_Conference_2014_Sea_Level_Trends.pdf] Cited in: Ch 20(1); Ch 20(2); Ch 20(3)
CSIRO & BoM 2010, State of the Climate, CSIRO and Australian Bureau of Meteorology, Canberra [www.bom.gov.au/inside/eiab/State-of-climate-2010-updated.pdf] Cited in: Ch 20(1); Ch 20(2)
DEC 2005, Marine Water Quality Objectives for NSW Ocean Waters, Department of Environment and Conservation NSW, Sydney [www.environment.nsw.gov.au/water/mwqo/index.htm] Cited in: Ch 20
DECC 2009, NSW Diffuse Source Water Pollution Strategy, Department of Environment and Climate Change NSW, Sydney [www.environment.nsw.gov.au/resources/water/09085dswp.pdf] Cited in: Ch 20; Ch 17
DECCW 2010a, NSW Climate Impact Profile, Department of Environment, Climate Change and Water NSW, Sydney [www.climatechange.environment.nsw.gov.au/Impacts-of-climate-change/2010-NSW-climate-impact-reporting] Cited in: Ch 20(1); Ch 20(2); Ch 20(3); Ch 6; Ch 11
DECCW 2010b, NSW Natural Resources Monitoring, Evaluation and Reporting Strategy 2010–2015, Department of Environment, Climate Change and Water NSW, Sydney [www.environment.nsw.gov.au/resources/soc/10977nrmmerstrat1015.pdf] Cited in: Ch 20; Ch 10; Ch 13
EPA 2012, New South Wales State of the Environment 2012, NSW Environment Protection Authority, Sydney [www.epa.nsw.gov.au/soe/soe2012] Cited in: Ch 20(1); Ch 20(2); Ch 10; Ch 11; Ch 12(1); Ch 12(2); Ch 13(1); Ch 13(2)
Fabry, VJ, Seibel, BA, Feely, RA & Orr, JC 2008, 'Impacts of ocean acidification on marine fauna and ecosystem processes', ICES Journal of Marine Science, 65, pp. 414–32 [dx.doi.org/10.1093/icesjms/fsn048] Cited in: Ch 20
Goudkamp, K & Chin, A 2006, 'Mangroves and saltmarshes' in A Chin (ed.), The State of the Great Barrier Reef On-line, Great Barrier Reef Marine Park Authority, Townsville [www.gbrmpa.gov.au/__data/assets/pdf_file/0020/3971/SORR_Mangroves_Saltmarshes.pdf] Cited in: Ch 20
Hobday, AJ & Lough, JM 2011, 'Projected climate change in Australian marine and freshwater environments', Marine and Freshwater Research, 62(9), pp. 1000–14 [dx.doi.org/10.1071/MF10302] Cited in: Ch 20
Hobday, AJ, Okey, TA, Poloczanska, ES, Kunz, TJ & Richardson, AJ (eds) 2006, Impacts of Climate Change on Australian Marine Life: Part B Technical Report, report to the Australian Greenhouse Office, Canberra [eprints.utas.edu.au/2534] Cited in: Ch 20
IPCC 2007, Climate Change 2007: Synthesis Report, Contribution of Working Groups I, II and III to the Fourth Assessment Report of the Intergovernmental Panel on Climate Change, [Core Writing Team, Pachauri, RK and Reisinger, A (eds.)], IPCC, Geneva, Switzerland, 104 pp. [www.ipcc.ch/publications_and_data/publications_ipcc_fourth_assessment_report_synthesis_report.htm] Cited in: Ch 20
Last, PR, White, WT, Gledhill, DC, Hobday, AJ, Brown, R, Edgar, GJ & Pecl, G 2011, 'Long-term shifts in abundance and distribution of a temperate fish fauna: a response to climate change and fishing practices', Global Ecology and Biogeography, 20(1), pp 58–72. [dx.doi.org/10.1111/j.1466-8238.2010.00575.x] Cited in: Ch 20
Lenton, A, Tilbrook, B, Matear, RJ, Sasse, T & Nojiri, Y 2015. 'Historical reconstruction of ocean acidification in the Australian region', Biogeosciences Discussions, 12, pp. 8265–97 [dx.doi.org/10.5194/bgd-12-8265-2015] Cited in: Ch 20(1); Ch 20(2)
Ling, SD, Johnson, CR & Ridgway, K 2009, 'Climate-driven range extension of a sea urchin: inferring future trends by analysis of recent population dynamics', Global Change Biology, 15(3), pp. 719–31 [dx.doi.org/10.1111/j.1365-2486.2008.01734.x] Cited in: Ch 20
MEMA 2015, Threat and Risk Assessment Framework for the NSW Marine Estate, Marine Estate Management Authority, Nelson Bay, NSW [www.marine.nsw.gov.au/__data/assets/pdf_file/0010/561628/NSW-marine-estate_threat-and-risk-assess-framework.PDF] Cited in: Ch 20
NHMRC 2008, Guidelines for Managing Risks in Recreational Water, National Health and Medical Research Council, Canberra [www.nhmrc.gov.au/guidelines/publications/eh38] Cited in: Ch 20
NSW Government 1997, NSW Coastal Policy 1997: A sustainable future for the New South Wales coast, NSW Government, Sydney [www.planning.nsw.gov.au/Policy-and-Legislation/Coastal/NSW-Coastal-Policy] Cited in: Ch 20
OEH 2011, Observed Changes in New South Wales Climate 2010, NSW Office of Environment and Heritage, Sydney [www.climatechange.environment.nsw.gov.au/~/media/NARCLim/Files/PDF%20resources/20110203obsnswclim2010.pdf] Cited in: Ch 20
OEH 2013a, Assessing estuary ecosystem health: Sampling, data analysis and reporting protocols, Monitoring, Evaluation and Reporting Program Technical Report, NSW Office of Environment and Heritage, Sydney [www.environment.nsw.gov.au/soc/130125esthlthprot.htm] Cited in: Ch 20(1); Ch 20(2); Ch 20(3)
OEH 2013b, Guidelines for Preparing Coastal Zone Management Plans, Office of Environment and Heritage, Sydney [www.environment.nsw.gov.au/resources/coasts/130224CZMPGuide.pdf] Cited in: Ch 20
OEH 2014, State of the Beaches 2013–2014, NSW Office of Environment and Heritage, Sydney [www.environment.nsw.gov.au/beach/Reportann.htm] Cited in: Ch 20
Ridgway, KR 2007, 'Long-term trend and decadal variability of the southward penetration of the East Australian Current', Geophysical Research Letters, 34, L13613 [dx.doi.org/ 10.1029/2007GL030393] Cited in: Ch 20
Rogers, K, Saintilan, N & Wilton, K 2006, 'Vegetation change and surface elevation dynamics of the estuarine wetlands of southeast Australia', Estuarine, Coastal and Shelf Science, 66(3–4), pp. 559–69 [dx.doi.org/10.1016/j.ecss.2005.11.004] Cited in: Ch 20
Roper, T, Creese, B, Scanes, P, Stephens, K, Williams, R, Dela-Cruz, J, Coade, G, Coates, B & Fraser, M 2011, Assessing the Condition of Estuaries and Coastal Lake Ecosystems in NSW, Monitoring, Evaluation and Reporting Program Technical Report, NSW Office of Environment and Heritage, Sydney [www.environment.nsw.gov.au/soc/socTechReports.htm] Cited in: Ch 20(1); Ch 20(2); Ch 20(3); Ch 20(4); Ch 20(5); Ch 20(6); Ch 20(7)
Saintilan, N & Williams, RJ 1999, 'Mangrove transgression into saltmarsh environments in south-east Australia', Global Ecology and Biogeography, 8(2), pp. 117–24 [dx.doi.org/10.1046/j.1365-2699.1999.00133.x] Cited in: Ch 20
Saintilan, N & Williams, RJ 2000, 'Short note: the decline of saltmarsh in southeast Australia – results of recent surveys', Wetlands (Australia), 18(2), pp. 49–54 [ojs.library.unsw.edu.au/index.php/wetlands/issue/view/60/showToc] Cited in: Ch 20
White, NJ, Haigh, ID, Church, JA, Koene, T, Watson, CS, Pritchard, TR, Watson, PJ, Burgette, RJ, McInnes, KL, Youh, Z-J, Zhanga, X & Tregoning, P 2014, 'Australian sea levels—Trends, regional variability and influencing factors', Earth-Science Reviews, 136, pp. 155–74 [dx.doi.org/10.1016/j.earscirev.2014.05.011] Cited in: Ch 20