
The major inland river systems are affected by the ongoing impacts of water extraction and altered river flows, and catchment changes such as vegetation clearing. Generally the greatest signs of ecosystem stress occur where flow regimes have changed most.
Coastal rivers are less affected by flow regulation so with the exception of fish communities, are in better ecological health.
Fish communities are generally in poor condition across the state and continue to decline within the Murray–Darling Basin. The widespread distribution of introduced carp in the Murray–Darling Basin has had a significant impact on the health of fish communities.
Exceedances of water quality standards for the nutrients phosphorus and nitrogen have improved, largely due to revised standards, which take better account of the variability that occurs naturally at the regional level.
The NSW Government is finalising water sharing plans for all major rivers in NSW to ensure a balance between human uses of water and the environment. Seventy plans have been implemented across NSW including all for the Murray–Darling Basin, with the remaining coastal plans to be completed in 2015.
Environmental water management plans enable water to be directed to protect important environmental assets on a priority needs basis.
Related themes: 12 Threatened species | 15 Invasive species | 16 Water resources | 17 River health
NSW indicators
| Indicator and status | Environmental trend |
Information availability |
|
|---|---|---|---|
| SRA ecosystem health index for Murray-Darling Basin rivers | Stable | ✔ | |
| River condition index for NSW rivers | Unknown | ✔ | |
| Health of fish assemblages | Increasing impact | ✔ ✔ | |
| Nitrogen and phosphorus levels | Decreasing impact | ✔ ✔ | |
Notes: Terms and symbols used above are defined in About SoE 2015 at the front of the report.
Context
Healthy riverine ecosystems, comprising rivers and their riparian zones, floodplains and wetlands, are vital for the maintenance of aquatic and terrestrial biodiversity. Healthy rivers are also critical to provide the ecosystem services necessary to maintain good water quality and supply, and enable opportunities for future economic growth. Rivers support a variety of human uses, including activities such as agriculture, aquaculture, fishing, recreation and tourism. A primary objective of river management is to achieve a long-term balance, whereby the integrity of natural systems is preserved while providing for a range of beneficial human uses.
Status and trends
NSW has approximately 58,000 kilometres of rivers and major streams, which can generally be categorised as either short, high-gradient coastal streams or long, low-gradient inland rivers. About 97% of river length in NSW has been substantially modified (NLWRA 2002). Typical changes include the regulation of river flows and extraction of water, removal of riverine vegetation, sedimentation from erosion of land and river banks, and the introduction of exotic species.
River health
Ecosystem health
The Sustainable Rivers Audit (SRA) developed a rigorous method to assess the ecosystem health of rivers in the Murray–Darling Basin based on indexes for hydrology, fish, macroinvertebrates, riparian vegetation and physical form (Davies et al. 2012).
While further data has been collected up till 2014, a full assessment of river health under the SRA has not been completed since 2010, using the data collected during the previous three years of sampling. Map 4.2 in SoE 2012 (EPA 2012) still displays the most current SRA ratings of ecosystem health available, by river valley for the inland rivers of the Murray–Darling Basin. Overall, the Paroo was the only river found to be in good ecosystem health, with the Condamine-Culgoa and Warrego rivers being in moderate health. Most other rivers received ecosystem health ratings of poor or very poor.
Since SoE 2012 the River Condition Index (RCI) methodology has been developed which provides an alternative assessment of river condition to the SRA and one that is applicable to all rivers in NSW. It is based on five component indexes: riparian vegetation cover, hydrological stress, biodiversity condition, geomorphic condition and catchment disturbance (Healey et al. 2012). This method provides spatial coverage across all of NSW, but data for all the indexes may not be available for all river systems.
Using data that is largely the same as that used for the last SRA analysis and covering a similar time span, an initial RCI map was compiled for all of NSW. This is displayed in Map17.1.
Map 17.1: River condition index
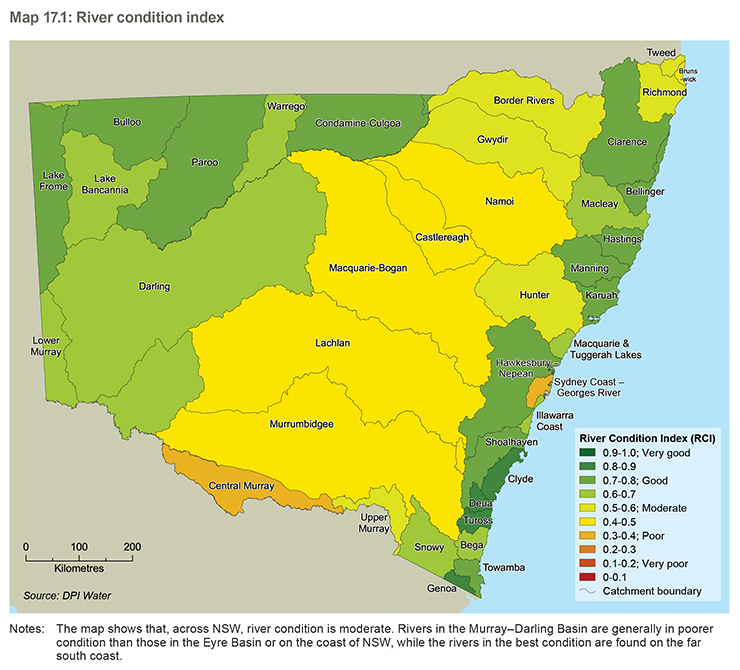
Notes: The map shows that, across NSW, river condition is moderate. Rivers in the Murray–Darling Basin are generally in poorer condition than those in the Eyre Basin or on the coast of NSW, while the rivers in the best condition are found on the far south coast.
Fish
While little new data has become available for the macroinvertebrate, riparian vegetation or physical form components of the SRA index or the RCI, data from 2012–14 is available on fish communities for significant parts of NSW, including much of the Murray–Darling Basin and some northern coastal rivers.
The data that has been collected (Table 17.1) shows little change in the composition of freshwater fish assemblages since SoE 2012. For those catchments where a full condition assessment is available, condition has improved slightly in the Bogan and Namoi valleys, declined slightly in the Castlereagh and Macquarie valleys, and declined markedly, from 'poor' to 'extremely poor' condition in the NSW portion of the Condamine-Culgoa catchment.
Table 17.1: Changes in fish condition index for NSW Murray–Darling Basin rivers, 2009–11 to 2012–14
| Valley | 2009–2011 | 2012–2014 |
|---|---|---|
| Border Rivers | Moderate | n/a |
| Condamine-Culgoa | Poor | Extremely poor |
| Warrego River | Very poor | Very poor |
| Paroo River | Moderate | Moderate |
| Gwydir River | Poor | Poor |
| Namoi River | Very poor | Poor |
| Castlereagh River | Very poor | Extremely poor |
| Bogan River | Very poor | Poor |
| Macquarie River | Very poor | Extremely poor |
| Darling River | Poor | n/a |
| Lachlan River | Extremely poor | Extremely poor |
| Murrumbidgee River | Extremely poor | Extremely poor |
| Upper Murray River | Extremely poor | n/a |
| Central Murray River | Very poor | n/a |
| Lower Murray River | Poor | n/a |
Source: Department of Primary Industries data 2015
Of the 10 catchments where overall fish condition index scores could be produced for the whole catchment, none were rated as being in 'good' condition. One catchment was in 'moderate' condition, three were 'poor', and one was 'very poor'. Five river valleys were rated as being in 'extremely poor' condition, (in descending order), the Castlereagh, Condamine-Culgoa, Macquarie, Murrumbidgee and Lachlan.
Three indicator measures make up the score for the overall fish condition index:
- Expectedness is the proportion of fish species collected at a site compared to the species expected to occur at a site or zone prior to 1788 (Muschal et al. 2010; Davies et al 2012). It has declined slightly across all valleys since SoE 2012, from an average of 37 to 33. This is largely due to decreases in the Castlereagh, Macquarie and Condamine-Culgoa valleys.
- Recruitment of native fish has declined slightly since SoE 2012, from an average of 49 to 42. However, the patterns of change for fish recruitment differed markedly between valleys, increasing substantially in the Bogan and Warrego valleys while declining in the Condamine-Culgoa, Macquarie, Castlereagh and Gwydir valleys.
- Nativeness is the proportion of native species to introduced species for the three metrics of species richness, abundance and biomass combined (Muschal et al. 2010; Davies et al 2012). This declined substantially across most of the analysed valleys from an average of 52 to 40 and is largely due to the widespread recruitment of carp immediately prior to and during the current reporting period.
Threatened species
The decline in biodiversity and the number of species listed as threatened is a serious environmental concern (see Theme 12: Threatened species). While it may be more widely recognised that many terrestrial mammals, birds and other species are threatened, a number of aquatic species are also under threat. In NSW, nine of the 28 native freshwater fish species found in the NSW portion of the Murray–Darling Basin are listed as threatened with extinction under the Fisheries Management Act 1994, and an additional four species of fish have populations listed as endangered. Seven freshwater invertebrates are also listed as threatened species under the Act.
Water quality
Water quality targets
SoE 2012 demonstrated that there was little relationship between standard water quality targets and aquatic ecosystem health, due to the highly variable nature of natural water quality regionally (see the discussion under 'Water quality by river valley' in the Water quality section of SoE 2012). New catchment zone water quality targets developed under the Murray–Darling Basin Plan 2012 (Schedule 11) are now being used to assess water quality at inland monitoring stations, replacing the previous default trigger values for slightly disturbed ecosystems listed in the National Water Quality Management Strategy (NWQMS), (ANZECC & ARMCANZ 2000). The NWQMS guidelines are still being used to assess coastal sites, but are currently being reviewed.
Nutrients
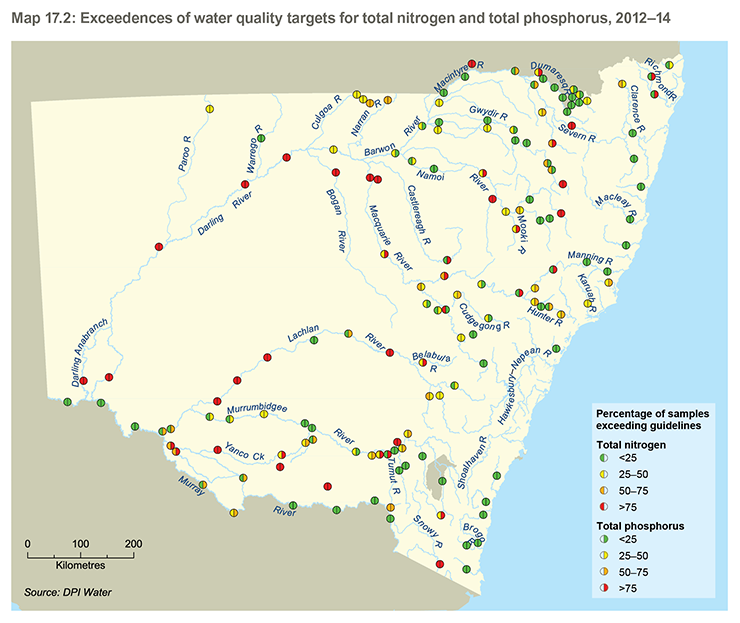
Nutrients, especially nitrogen and phosphorus, can have a significant effect on water quality when present in excess of ecosystem needs. Map 17.2 shows the percentage of water samples from streams across NSW that had nitrogen and phosphorus concentrations above water quality targets.
There are fewer inland sites with greater than 75% exceedence for both total nitrogen and total phosphorus than in SoE 2012. This is largely attributable to the use of the revised targets discussed above.
Inland sites that rate poorly for both total nitrogen and total phosphorus are located in the Border Rivers region, Gwydir and Namoi (montane zone C2 of the Basin Plan) where they are related to the basalt derived soils in those areas, and in the Lower Lachlan River (zone A3 of the Basin Plan). Poor ratings were also found in the middle and lower Darling zone and the upper and middle central Murray zone due to anomalies in the setting of the new targets. In the former, due to data deficiencies, default NWQMS targets were still applied, while in the latter several tributaries should more appropriately be allocated to the Murrumbidgee, not the Murray River.
Only one coastal site, Little Plains River at Wellesley in the Snowy River catchment, had greater than 75% exceedence for both total nitrogen and total phosphorus.
Map 17.2: Exceedences of water quality targets for total nitrogen and total phosphorus, 2012–14
Pressures
Water extraction and altered flow regimes
Natural river flows have been modified by the effects of water extraction and particularly in inland NSW, the regulation and control of flows through the installation of dams and other structures (see Theme 16: Water resources). Modified flow regimes, including dampening of both the peaks and troughs, impacts the critical ecological processes that trigger breeding events for bird and fish species, and these have been a significant factor in the decline of aquatic ecosystems over the longer term. Flow regimes are also important for creating and maintaining physical habitat within the channels of NSW rivers.
Blockages to fish passage
Many of Australia's native fish species rely on the ability to access suitable habitat to complete different stages of their lifecycles.
The 'installation and operation of instream structures and other mechanisms that alter natural flow regimes and streams' has been listed as a key threatening process under the Fisheries Management Act 1994. This disruption to migration by native fish populations leads to exclusion from large areas of vital breeding and spawning habitat, restricts access to food sources, limits the availability of shelter leading to an increase in predation, and reduces genetic variability within populations. A database has been compiled by Fisheries NSW of all known fish barriers across NSW. Currently, over 10,000 structures have been identified with over 4000 of them listed as barriers to fish. Dams, weirs and regulators are the most common type of major barrier with over 1800 identified across the state. In addition over 1775 road crossings also block fish passage.
Infrastructure hazards
Each year a large portion of water is diverted for irrigation purposes by means of diversion channels and pumps. In the process many adult fish are caught up in pumps or entrained in irrigation canals. If pumping is occurring during spawning season, eggs and larvae are also destroyed. On the Namoi River, some pumping stations have been recorded removing over 200 fish per day (Baumgartner et al. 2009). There are over 4546 pumps greater than 200 millimetres in size within the western flowing rivers in NSW.
Fluid shear stress is a common issue associated with undershot (gated) weirs. Within the Murray–Darling Basin, more than 80% of main channel weirs employ an undershot design (Boys et al. 2014).
High levels of mortality can be sustained in eggs and larvae as they pass through an undershot weir due to the distortion encountered. Small scale experiments have indicated that golden perch display a high susceptibility to fluid shear stress with mortality rates in eggs exceeding 90% (Boys et al. 2014; Baumgartner et al. 2006).
Cold water pollution
Discharging water from the bottom of dams results in colder water being injected into sensitive downstream ecosystems. The cold water released alters the thermal regime of rivers, sometimes for hundreds of kilometres downstream. The effects of cold water pollution (CWP) are known to impact a range of physiological and biological processes in native fish species including feeding, spawning, hatching and larval development (Lugg & Copeland 2014).
Within NSW, nine dams are believed to cause 'relatively large and pervasive' CWP (Blowering, Burrendong, Burrinjuck, Copeton, Hume, Keepit, Khancoban, Pindari and Wyangala) with some downstream temperatures dropping more than 10°C below natural summer conditions.
Catchment disturbance
The extent of vegetation cover within a catchment and local land use and land management practices such as agriculture and urban development affect the extent of water pollution, particularly increased nutrient and sediment levels in the river or stream, and modify the geomorphology of the river channel. Examples of these impacts include the widening of channels, head cut incisions in headwater streams and increased sediment loads that smother aquatic habitats (Brierley & Fryirs 2005). Generally, the more intensive the development the greater the impact on riverine ecosystems.
Invasive species
Alien fish compete with native species and prey on fish and frog eggs, tadpoles and juvenile fish, fundamentally altering food webs. Freshwater fish surveys over the past three years found:
- 8% of all sites sampled were free from introduced fish, mainly in coastal rivers
- 12.7% of sites contained only introduced fish
- introduced taxa accounted for 50% of the fish species collected at each site, 52% of total fish abundance and 72% of total fish biomass, averaged across all sites.
These numbers are higher than those reported in SoE 2012, even allowing for the greater proportion of sampling that occurred in the Murray–Darling Basin during the latest surveys.
In late 2014, DPI confirmed the first record of the pest fish tilapia (Mozambique mouthbreeder) in a northern NSW coastal catchment near Cabarita Beach (see Theme 15: Invasive species).
Drought
Although the Australian landscape is adapted to natural drought conditions and many species' lifecycles rely on the natural variability in river flows that results, prolonged drought is a major disturbance to riverine systems and can place severe stress on aquatic ecosystems.
Climate change
Climate change is likely to have an incremental impact on existing pressures, particularly water availability and altered river flows. Cumulatively the consequences of these pressures could be substantial as important ecological thresholds may be crossed (CSIRO 2008).
The pressures described above have not changed greatly since SoE 2012 and many were described in greater detail there.
Responses
Water and flow management
Water sharing plans
Water sharing plans are a significant water management tool for addressing river health in NSW. They improve the management of river flows and water extraction practices and protect a proportion of all flows for the environment. Seventy water sharing plans have now been implemented across NSW, including all of those for the Murray–Darling Basin. The remaining coastal plans will be completed in 2015.
Under the Basin Plan, the water sharing plans in the Murray–Darling Basin will be replaced by 22 water resource plans by 2019. Water sharing plans and water resource plans are described in greater detail in Theme 16: Water resources.
Environmental water recovery
The NSW Government has purchased or recovered water for the environment through a number of water recovery programs. The cumulative total for all adaptive environmental water at June 2014 was 397,418 ML (see also Theme 16: Water resources).
In addition the Australian Government is recovering significant volumes of water across the Murray–Darling Basin to meet the recovery targets under the Basin Plan. As at May 2015, the Australian Government's NSW environmental water holdings for surface water amounted to 1,341,518 ML.
NSW and Australian Government agencies work together on the release and management of environmental water holdings. This environmental water is managed through:
- annual environmental watering plans that outline the priorities for how environmental water is to be used in the coming year, depending on climatic factors and water availability
- environmental water management plans that are strategic plans for wetlands, which provide a link between environmental water management and the activities undertaken by other government agencies. These plans identify environmental assets and values, assess water-use priorities, and outline the water and land management issues that need to be addressed to support environmental values.
Rural floodplain management plans
Rural floodplain management plans have been or are being implemented for 21 floodplains.
The objective of the plans is to enhance the health of flood-dependent ecosystems by increasing floodplain connectivity while also managing the risk from flooding through control of development that is likely to block or redistribute flows during floods. Floodplain management plans are statutory plans under the Water Act 1912 and Water Management Act 2000 and form the basis for assessing floodplain work approvals (see Theme 16: Water resources for more details).
Pollution
NSW diffuse source water pollution strategy
Pollution from diffuse sources accounts for the majority of pollutant loads in the state's waterways. The objective of this strategy (DECC 2009) is to reduce diffuse source water pollution in all NSW surface and ground waters. To do so, it focuses on sources of priority pollutants that are not currently regulated. The three main pollutants to be addressed are sediments, nutrients and pathogens, which can arise from a multitude of sources, including agricultural land uses, sealed and unsealed roads, and urban stormwater.
Cold water pollution
A floating curtain system at the Burrendong dam intake tower was completed in 2014 to reduce the impact of cold water pollution on the Macquarie River. The newly installed system is designed to allow warmer surface water to be released in order to restore more natural temperatures downstream. Initial testing has indicated that a positive effect is being reflected downstream since the installation of the system. While an overall mean recovery of 2.5°C has been recorded, further improvements are being investigated.
Fish habitat
Fish habitat policy and guidelines
In 2013, an updated policy and guidelines were published aimed at maintaining and enhancing fish habitat in NSW for the benefit of native fish species (including threatened species) in marine, estuarine and freshwater environments (DPI 2013).
Fishways
Since 2013, 34 structures have been remediated, opening approximately 5500 kilometres of river habitat. This remediation included several removal projects, the construction of 13 fishways as well as the replacement of low level road crossings and causeways with larger fish friendly box culverts, allowing fish passage and better flood access for landholders.
Future opportunities
The monitoring of habitat and ecosystem responses to environmental flows will allow knowledge to be refined so that through adaptive management better targeting of high-value ecosystems can occur, enhancing the benefits of such flows.
While point sources of water pollution are generally well-managed, there is still scope to improve the management of diffuse-source pollution, primarily from agricultural runoff and urban stormwater. Stormwater harvesting developments, runoff controls and initiatives to promote revegetation and better land management practices in catchments are being implemented to improve water quality.
References
ANZECC & ARMCANZ 2000, Australian and New Zealand Guidelines for Fresh and Marine Water Quality, Australian and New Zealand Environment and Conservation Council and Agriculture and Resource Management Council of Australia and New Zealand, Canberra [www.environment.gov.au/water/publications/quality/nwqms-guidelines-4-vol1.html] Cited in: Ch 17; Ch 20(1); Ch 20(2)
Baumgartner, LJ, Reynoldson, N & Gilligan, DM 2006, 'Mortality of larval Murray cod (Maccullochella peelii peelii) and golden perch (Macquaria ambigua) associated with fish passage through two types of low-head weirs', Marine and Freshwater Research, 57(2), pp.187–191 [dx.doi.org/10.1071/MF05098] Cited in: Ch 17
Baumgartner, LJ, Reynoldson, NK, Cameron, L & Stanger, JG 2009, 'Effects of irrigation pumps on riverine fish', Fisheries Management and Ecology, 16(6), pp. 429–437 [dx.doi.org/10.1111/j.1365-2400.2009.00693.x] Cited in: Ch 17
Boys, C, Navarro, A, Robinson, W, Fowler, A, Chilcott, S, Miller, B, Pflugrath, B, Baumgartner, L, McPherson, J, Brown, R & Deng, Z 2014, Downstream fish passage criteria for hydropower and irrigation infrastructure in the Murray – Darling Basin, Final Report Series No. 141, Department of Primary Industries, Nelson Bay [www.dpi.nsw.gov.au/__data/assets/pdf_file/0009/545751/FFRS-141_Boys-et-al-2014.pdf] Cited in: Ch 17(1); Ch 17(2)
Brierley, GJ & Fryirs, KA 2005, Geomorphology and River Management: Applications of the river styles framework, Blackwell Publications, Oxford, UK [au.wiley.com/WileyCDA/WileyTitle/productCd-1405115165.html] Cited in: Ch 17
CSIRO 2008, Water Availability in the Murray–Darling Basin: A report to the Australian Government from the CSIRO Murray–Darling Basin Sustainable Yields Project, Commonwealth Scientific and Industrial Research Organisation, Canberra [https://publications.csiro.au/rpr/pub?list=SEA&pid=legacy:530] Cited in: Ch 17; Ch 16(1); Ch 16(2); Ch 19
Davies, PE, Stewardson, MJ, Hillman, TJ, Roberts, JR & Thoms, MC 2012, Sustainable Rivers Audit: A report on the ecological health of rivers in the Murray–Darling Basin 2008–2010, Report 2, Vol. 1–3, Murray–Darling Basin Authority, Canberra Cited in: Ch 17(1); Ch 17(2); Ch 17(3)
DECC 2009, NSW Diffuse Source Water Pollution Strategy, Department of Environment and Climate Change NSW, Sydney [www.environment.nsw.gov.au/water/dswp.htm] Cited in: Ch 17; Ch 20
DPI 2013, Policy and guidelines for fish habitat conservation and management, NSW Department of Primary Industries, Wollongbar [www.dpi.nsw.gov.au/fisheries/habitat/publications/policies,-guidelines-and-manuals/fish-habitat-conservation] Cited in: Ch 17
EPA 2012, New South Wales State of the Environment 2012, NSW Environment Protection Authority, Sydney [www.epa.nsw.gov.au/soe/soe2012] Cited in: Ch 17; Ch 2; Ch 7; Ch 8; Ch 12(1); Ch 12(2); Ch 13(1); Ch 13(2); Ch 14; Ch 16; Ch 19; Ch 20(1); Ch 20(2)
Healey, M, Raine, A, Parsons, L & Cook, N 2012, River Condition Index in New South Wales: Method development and application, NSW Office of Water, Sydney [www.water.nsw.gov.au/water-management/monitoring/catchments#index] Cited in: Ch 17
Lugg, A & Copeland, C 2014, 'Review of cold water pollution in the Murray–Darling Basin and the impacts on fish communities', Ecological Management & Restoration, 15, pp. 71–79 [dx.doi.org/10.1111/emr.12074] Cited in: Ch 17
Muschal, M, Turak, E, Miller, J, Gilligan, D, Sayers, J & Healey, M 2010, Technical Support Document – Riverine Ecosystems: NSW State of the Catchments 2008, NSW MER technical report series, NSW Office of Water, Parramatta [www.water.nsw.gov.au/__data/assets/pdf_file/0009/548442/monitor_catchments_10_228_mer_riverine_ecosystems.pdf] Cited in: Ch 17(1); Ch 17(2)
NLWRA 2002, Australian Catchment, River and Estuary Assessment 2002: Volume 1,National Land and Water Resources Audit, Canberra [lwa.gov.au/products/pr020282] Cited in: Ch 17