
Land clearing has been recognised as the main threat to the extent and condition of native vegetation in NSW. With improved technology for the monitoring of clearing it is now recognised that the level of clearing is relatively low, at around 11,000 hectares per year.
While some vegetation classes, particularly woodlands and grasslands, have been substantially depleted since European settlement, others remain largely intact.
Vegetation condition largely reflects the primary land use and is being addressed through better land management practices. However, pressures on condition are likely to remain for the foreseeable future, due to the long-term effects of fragmentation following clearing, coupled with increasing pressures from invasive species and climate change.
Substantial programs of restoration and revegetation that are occurring at local and regional levels are expected to lead to improvements in the condition of vegetation over the longer term.
Related themes: 10 Soil condition | 11 Sustainable land management | 14 Protected areas and conservation | 15 Invasive species | 17 River health | 18 Wetlands | 20 Coastal, estuarine and marine ecosystems
NSW indicators
| Indicator and status | Environmental trend |
Information availability |
|
|---|---|---|---|
| Clearing rate for woody native vegetation | Stable | ✔ ✔ ✔ | |
| Extent of native vegetation | Stable | ✔ ✔ | |
| Condition of native vegetation | Increasing impact | ✔ | |
| Levels of pressures on native vegetation condition | Stable | ✔ | |
Notes: Terms and symbols used above are defined in About SoE 2015 at the front of the report.
Context
NSW contains a great variety of native vegetation, with outstanding examples of rainforests, eucalypt forests and woodlands, grasslands, wetlands, coastal heaths, alpine habitats and arid shrublands. Native vegetation provides essential habitat for plant and animal species, and is an integral component of healthy, functioning ecosystems.
Native vegetation extent and condition are indicators of ecosystem health and diversity (Saunders et al. 1998). Generalised mapping based only on vegetation structure and growth form provides a useful overview for reporting on the statewide status and extent of native vegetation, but is less descriptive of ecosystems and habitats than more detailed mapping of vegetation that is based on information about species composition. The description in this section is largely based on generalised mapping as more detailed mapping is not yet available on a consistent basis across the state.
This theme is only concerned with the state of terrestrial vegetation. Freshwater aquatic vegetation is considered in Theme 18: Wetlands, and coastal aquatic vegetation is considered in Theme 20: Coastal, estuarine and marine ecosystems.
Status and trends
Vegetation extent
Information on the extent of NSW native vegetation was compiled under the NSW Natural Resources Monitoring Evaluation and Reporting Strategy 2010–2015 (DECCW 2010) by combining vegetation mapping with remote sensing analysis (Dillon et al. 2011). The extent of native vegetation was described according to four 'vegetation extent categories', which represented various levels or degrees of modification, and was presented as Map 7.1 under Vegetation extent in SoE 2009 (DECCW 2009). A summary of the outcomes is displayed below in Table 13.1.
Table 13.1: Extent of native vegetation in NSW
| Vegetation extent category | Description | Area (% of state) |
Proportion woody (%)* |
|---|---|---|---|
| Native – intact | Native vegetation in which the structure has not been substantially altered | 61% | 55% |
| Native – derived | Vegetation that is predominantly native but is no longer structurally intact as it has been substantially altered and is missing important structural components or layers | 8% | 50% |
| Native/non-native mosaic | Vegetation that cannot be classified as native or non-native using current remote sensing technologies | 20% | 15% |
| Non-native/other | Non-native vegetation (crops, plantations, pasture) or other non-vegetative land cover | 11% | – |
Source: EPA 2012
Notes: * This describes the percentage of each category that is woody and figures do not sum to 100%. Overall, 45% of all native vegetation was categorised as woody.
In 2012 the data from 2009 was combined with the most current map of change in woody vegetation to determine how much of each extent category is comprised of woody vegetation (SoE 2012). Map 5.1 under Vegetation extent in SoE 2012 depicts the location and extent of native vegetation that is woody or non-woody in each of the extent modification categories.
Monitoring of woody vegetation and definitions of what is regarded as woody vegetation are described below under 'Clearing of woody vegetation'.
Extent of intact native vegetation
'Native – intact' vegetation covers 61% of NSW. Vegetation communities that occur naturally can still be identified in this category as the vegetation retains its structural integrity (Keith & Simpson 2006; Keith & Simpson 2008), but these communities are not necessarily in good condition. Only 9% of native vegetation in NSW is regarded as being in close to natural condition as it is managed with conservation as the primary objective. The remaining vegetation in this category faces impacts from a variety of land uses, leading to changes in species composition and ecological function, reduced vigour or regeneration, and diminished habitat values.
The current extent of intact native vegetation in NSW reflects differing rates of clearing across various parts of the state. Generally, flat productive lands have been favoured for development, with particularly high rates of clearing in native grasslands, grassy woodlands, some types of wetlands and eucalypt forests. Some other native vegetation formations, such as arid shrublands and alpine areas, occur on land that is less attractive for development and so have experienced little change in extent. The status of intact native vegetation formations in NSW was summarised in Table 5.5 under Vegetation extent in SoE 2012.
Vegetation condition
Where native vegetation still exists, it ranges in condition from a close to natural state if undisturbed, to heavily degraded. Between these two extremes, native vegetation has been modified to varying degrees by land management practices and unplanned threats such as weed invasion, drought and fire. The negative impacts of these threats include:
- changes to the structure, ecological function and species composition of native vegetation
- lower rates of regeneration and reduced vigour
- prevalence of parasites, pathogens and diseases
- presence of weeds and pests.
The combined effect of these impacts diminishes habitat values and impairs ecosystem processes. Decline in vegetation condition is generally less immediately visible than clearing and occurs over a longer time frame, making it more difficult to monitor and assess.
A broad assessment of vegetation condition – largely based on generalised land-use mapping – where vegetation condition declines with an increase in land-use intensity, was presented in Map 7.2 under Vegetation extent in SoE 2009. The results of this mapping are summarised in Table 13.2. Both the condition categories and the area estimates are strongly aligned with the vegetation extent categories described in Table 13.1, as the extent categories in that table incorporate an inherent description of vegetation condition.
The map described the broad transformation that occurred to the structure of vegetation across the landscape when it was modified to make land suitable for a range of human uses, but it is static in nature and can only be updated if further major land-use changes have occurred since the map was prepared.
Table 13.2: Native vegetation condition classification
| Category | Description | Area (% of state) |
|---|---|---|
| Residual | Native vegetation structure, composition and regenerative capacity remain intact, with no significant land-use disturbance | 9% |
| Modified | The structure, composition and regenerative capacity are intact, with some land-use disturbance | 52% |
| Transformed | The structure, composition and regenerative capacity are significantly altered by land use | 7% |
| Indeterminate | Vegetation cannot easily be classified as either transformed or replaced | 19% |
| Replaced or managed | Native vegetation has been replaced by non-native vegetation | 12% |
| Removed | Native vegetation has been removed to leave non-vegetated land cover | 1% |
Source: DECCW 2009
Pressures
Vegetation extent
Land clearing
Native vegetation has been extensively cleared in NSW for settlement, industry and agriculture. Clearing facilitates land-use change and due to the ongoing nature of the subsequent uses of cleared land it is generally irreversible. The clearing process actively displaces many native animals and plants and has a negative impact on biodiversity. Over time, the effects of fragmentation and disturbance lead to weed invasion and further deterioration in the condition and habitat values of remnant vegetation.
Clearing is therefore accepted as being the main cause of vegetation change and decline. Clearing of native vegetation, and the associated destruction of habitat has been identified as the process representing the greatest single threat to biodiversity in NSW (Coutts-Smith & Downey 2006). Land clearing is also listed as a key threatening process under the Threatened Species Conservation Act 1995.
Clearing of woody vegetation
In the past, monitoring of the extent of clearing of woody vegetation in NSW has been conducted by analysing Landsat remote sensing data using the statewide landcover and trees study (SLATS) methodology (DNRW 2007). However, the Landsat 5 satellite failed in November 2011. Landsat monitoring was replaced by the analysis of SPOT 5 data from 2009–10 onwards, using the same methodology. There were two years of overlap where data was available for both platforms.
Woody vegetation change based on Landsat imagery had a 30-metre resolution, with an operational definition of woody vegetation being woody communities with 20% or more canopy cover, which are taller than about two metres (e.g. woodlands open forest and closed forest). SPOT 5 imagery has a five-metre resolution and provides more detailed mapping, detecting woody vegetation down to 5% crown cover, enabling the detection of change in open woodlands, grasslands with scattered trees and highly modified areas.
Comparison of the two platforms indicates differences in the estimates of change in woody vegetation derived from both platforms. SPOT 5 imagery detects more and smaller changes than Landsat, while the change estimates from Landsat tend to overestimate change due to the coarser resolution. The difference is dependent on the spatial pattern of change and is greater where clearing is discontinuous. Due to this variability, clearing rates derived from the two platforms are not directly comparable.
Figure 13.1 presents both Landsat and SPOT 5 data on the changes in woody vegetation due to clearing for agriculture, infrastructure development and forestry over the past 24 years of monitoring.
The estimate of clearing discussed in this report relates only to activities that lead to permanent changes in land use and landscape function, that is, changes due to agriculture and infrastructure development. The four years of SPOT 5 data from 2009–10 display a relatively stable pattern of clearing at about 11,000 hectares per year, apart from the unusually low result in 2010–11, attributed to a particularly wet year affecting the ability to conduct clearing operations. This pattern is also consistent with the last seven years of Landsat data, which have also displayed a relatively stable pattern from about 2004 compared to prior variations.
Forestry operations are not described as clearing because they do not lead to land-use change. Most areas where change is detected due to harvesting are expected to be regenerated as regrowth forest.
Figure 13.1: Woody vegetation change in NSW, 1988–90 to 2012–13
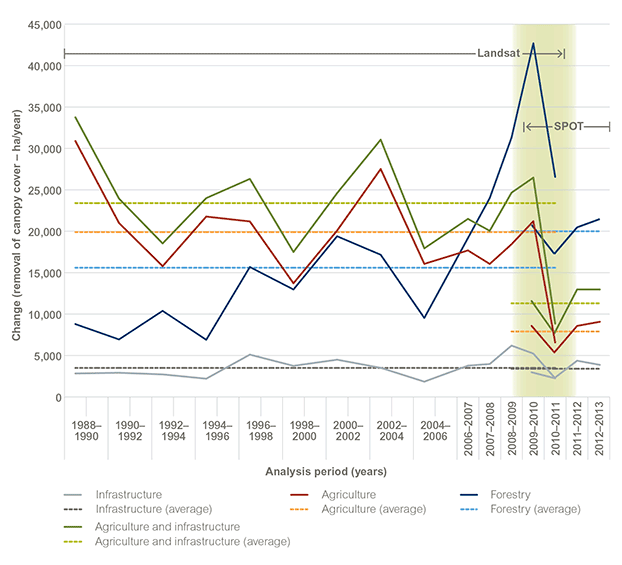
Source: OEH data 2015
Notes: Until 2006–07, the annual rate of clearing was derived from change detected over a two-year period (for example, 1988–90 represents two years from around the end of 1988 to around the end of 1990) with the value averaged over the two years. From 2006–07 onwards, assessments have been conducted yearly.
There is some variability in the actual length of the two-yearly or yearly intervals, depending on the availability of remote sensing data suitable for analysis due to seasonal factors.
Data for Figure 13.1
Monitoring of change due to increases in woody vegetation resulting from revegetation is inherently more complex than monitoring of clearing. A methodology is being developed to measure this and estimates of revegetation should be available in future reports. While no data is available as yet, it is expected that this will show that levels of clearing are being balanced by levels of revegetation.
Clearing of non-woody vegetation
However, not all clearing occurs through the direct removal of trees in areas covered by woody vegetation. Non-woody vegetation is taken to be vegetation that does not meet the criteria to be classified as woody vegetation. It refers to all grasslands and large areas of open woodlands and arid shrublands characteristic of western NSW.
Much of the native grassland in NSW has been cleared or modified by pasture improvement, through the application of fertilisers, and by the ploughing and sowing of introduced grasses and clovers. Some freshwater wetlands and arid shrublands have, in effect, also been cleared, by prolonged overgrazing.
Vegetation condition
Land use
Map 5.2 under Vegetation extent in SoE 2012 shows the levels of pressure from a variety of land uses on vegetation extent and condition. The specific land uses are described in Guidelines for Land Use Mapping in Australia: Principles, procedures and definitions (ABARES 2011). These have been reclassified into five categories of inferred pressure that describe the generally increasing levels of disturbance to native vegetation, as the intensity of the operations or processes associated with different land uses increases. The extent of vegetation in the individual pressure categories is summarised in Table 13.3. However, the intensity of land use is also affected or modified by the specific land management practices adopted in carrying out any specific land use (see Theme 11: Sustainable land management).
Table 13.3: Land-use pressure on native vegetation
| Category | Description | Area (% of state) |
|---|---|---|
| Conservation and natural environments | Land set aside primarily for conservation, where natural ecosystems are maintained | 18 |
| Relatively natural environments | Land used primarily for agriculture, with limited changes to native vegetation | 40 |
| Dryland agriculture and plantations | Land used mainly for agriculture, based on dryland farming | 38 |
| Irrigated agriculture and plantations | Land used mostly for agriculture, based on irrigated farming | 2 |
| Intensive uses | Land subject to extensive modification, generally in association with residential settlement, or commercial or industrial uses | 2 |
Source: EPA 2012
General pressures
Not all the pressures on vegetation condition are due to land use. The longer-term effects of fragmentation after clearing, invasive species (especially weeds and plant pathogens), altered fire regimes, soil degradation, overgrazing, changes to water regimes and the emerging effects of climate change are all pressures that affect the condition of native vegetation.
The impacts of land clearing on habitat have been discussed under 'Vegetation extent' above. However, habitat fragmentation caused by clearing continues to have long-term impacts on native vegetation well after the initial clearing occurs, primarily through dieback, invasions of weeds and feral animals, and loss of native species.
While most arid shrublands and grasslands are not subject to extensive clearing, they are affected by overgrazing, which represents the cumulative impact of native species, farm stock and feral pest animals. The effects of overgrazing are often compounded by cycles of drought. Overgrazing reduces the cover of ephemeral plants, simplifies fauna habitat and promotes an overabundance of species which are less palatable to grazing animals.
Changes to water regimes and the effects of drought have resulted in extensive dieback in floodplain forests and wetlands (see Theme 17: River health and Theme 18: Wetlands).
Climate change is pervasive and is expected to have increasing effects on all types of native vegetation in NSW. Alpine vegetation, wetlands and rainforests are likely to be especially sensitive (Laurence et al. 2011). The continuing reduction in snow cover in alpine habitats (Nicholls 2009) is decreasing the area and suitability of habitat for a range of specialised alpine species (Green & Pickering 2009).
Other significant and pervasive pressures affecting vegetation condition are discussed as separate issues in this report. These include soil degradation (see Theme 10: Soil condition) and invasive species (see Theme 15: Invasive species).
Responses
Native Vegetation Act 2003
The Native Vegetation Act 2003 (NV Act) has been the key legislation regulating the clearing of native vegetation in NSW. The Act came into effect in December 2005 and aims to prevent broadscale land clearing unless it maintains or improves environmental values. The Act regulates the clearing of native vegetation in most of NSW, except on land in urban areas and land excluded for major development, and in national parks, conservation areas, state forests and reserves (see Theme 14: Protected areas and conservation).
Native vegetation regulation
In September 2013 the regulation for the NV Act was revised and the Native Vegetation Regulation 2013 came into effect, to cut red tape for farmers while maintaining environmental protection. The new regulation clarifies the definitions for a range of routine agricultural management activities (RAMAs) where clearing does not require approval. It also introduced a new class of RAMAs – Ministerial Orders, which provides for self-assessable codes of practice that apply to the clearing of invasive native species, thinning and the clearing of paddock trees.
Property vegetation plans
The provisions of the NV Act are largely implemented through a framework of voluntary agreements called property vegetation plans (PVPs), which only permit clearing on properties if environmental values are maintained or improved. PVPs are based on maintaining or improving outcomes under four criteria in the Environmental Outcomes Assessment Methodology (EOAM): biodiversity, soil health, water quality and soil salinity. Local land services play a pivotal role in establishing PVPs with private landholders.
A range of other measures to improve landscape management, enhance the condition of native vegetation and maintain biodiversity are also implemented through PVPs. For example, special protection is provided for landscape and vegetation types that have been cleared to below 30% of their original extent, and measures are in place to reward landowners for voluntary conservation activities. Other activities are described under 'New restoration or revegetation of native vegetation' and 'New management of native vegetation' in Table 13.4.
Table 13.4: Summary of native vegetation management activities undertaken in NSW from 2005–06 to 2013–14
| Category | Description | Total area (last 3 years: 2011–12 to 2013–14) | Total area (2005–06 to 2013–14) |
|---|---|---|---|
| New conservation areas | New public reserves or additions as well as private conservation areas (see Theme 14: Protected areas and conservation) | 71,360 | 1,296,270 |
| New restoration or revegetation of native vegetation | Revegetation or rehabilitation of native vegetation, as part of incentives, wildlife refuges, or retained and improved as a condition to clear under PVPs | 711,850 | 2,588,220 |
| New management of native vegetation | Management through Invasive Native Scrub, Thinning and Private Native Forestry PVPs, new areas of public forest, weed removal programs, and management to reduce grazing pressure | 2,475,120 | 7,450,090 |
| New clearing of native vegetation | Approved clearing under NSW legislation including Native Vegetation Act 2003, former Native Vegetation Conservation Act 1997, Plantations and Reafforestation Act 1999 | 4,410 | 25,590 |
Source: OEH data 2015
Biodiversity legislation reforms
In 2014 the Minister for the Environment established an independent panel to review the Threatened Species Conservation Act 1995, Native Vegetation Act 2003, Nature Conservation Trust Act 2001 and parts of the National Parks and Wildlife Act 1974. The aims of the review were to recommend simpler, more streamlined and effective legislation to conserve biodiversity (including threatened species), support sustainable development and reduce red tape. The new legislative framework will repeal the Native Vegetation Act 2003 and associated regulations while seeking to continue to balance production imperatives with best available measures to minimise any adverse environmental impacts, particularly for threatened species or communities.
Management of native vegetation
Since 2006, the NSW Government has collected data on native vegetation programs from various agencies to produce the NSW Report on Native Vegetation (OEH 2011), including the native vegetation report card, which shows the extent of a range of activities conducted to manage native vegetation in NSW since 2005–06. These are summarised in Table 13.4.
The first three categories describe positive changes in the extent or condition, or both, of native vegetation, while the last category describes approved losses in the extent of vegetation.
In general, the total area of land being conserved, restored or undergoing improved management is substantially greater than the area approved for clearing. However, while the areas to improve the condition or management of native vegetation are quite substantial, it is still too early for many of the measures listed in Table 13.4 to be detectable as changes in the extent or condition of native vegetation described above.
Future opportunities
More regional programs involving local communities should provide greater opportunities to improve vegetation condition, enhance habitat connectivity and reduce fragmentation which will, over time, increase the resilience, health and productivity of native vegetation on public and private land.
Although clearing may be slowing and fragmentation reduced, the pressures that affect vegetation condition are likely to continue in the foreseeable future, due to further weed invasion and new weed incursions, the effects of plant diseases and pathogens, changes to fire regimes and the effects of climate change.
Work has commenced on developing a single Biodiversity Assessment Methodology (BAM) as part of the biodiversity reforms that will replace the EOAM and all other currently used methods. The BAM will streamline assessments by using a modular approach to assessing biodiversity and other environmental impacts (such as land degradation and salinity, currently assessed by the EOAM).
OEH has commenced a Native Vegetation Information Strategy 2014–18 to improve the quality, detail and utility of vegetation information to better inform the status of native vegetation in NSW. This includes more detailed mapping of vegetation and more robust descriptions of vegetation types and conditions.
References
Guidelines for Land Use Mapping in Australia: Principles, procedures and definitions, 4th edition, Australian Bureau of Agricultural and Resource Economics and Sciences, Canberra [www.agriculture.gov.au/abares/aclump/land-use/mapping-technical-specifications] Cited in: Ch 13
Coutts-Smith, AJ & Downey, PO 2006, Impact of Weeds on Threatened Biodiversity in New South Wales, Technical Series no.11, CRC for Australian Weed Management, Adelaide [www.southwestnrm.org.au/ihub/impact-weeds-threatened-biodiversity-new-south-wales] Cited in: Ch 13; Ch 12
DECCW 2009, NSW State of the Environment Report 2009, Department of Environment, Climate Change and Water NSW, Sydney [www.epa.nsw.gov.au/soe/soe2009] Cited in: Ch 13(1); Ch 13(2); Ch 10; Ch 11; Ch 12(1); Ch 12(2)
DECCW 2010, NSW Natural Resources Monitoring, Evaluation and Reporting Strategy 2010–2015, Department of Environment, Climate Change and Water NSW, Sydney [www.environment.nsw.gov.au/soc/20100977nrmmerstrat1015.htm] Cited in: Ch 13; Ch 10; Ch 20
Dillon, M, McNellie, M & Oliver, I 2011, Assessing the Extent and Condition of Native Vegetation in NSW, Monitoring, Evaluation and Reporting Program, Technical report series, NSW Office of Environment and Heritage, Sydney [www.environment.nsw.gov.au/soc/20110713NativeVegTRS.htm] Cited in: Ch 13
DNRW 2007, Land Cover Change in Queensland 2004–2005: A statewide land cover and trees study (SLATS) report, Department of Natural Resources and Water, Brisbane. Cited in: Ch 13
EPA 2012, New South Wales State of the Environment 2012, NSW Environment Protection Authority, Sydney [www.epa.nsw.gov.au/soe/soe2012] Cited in: Ch 13(1); Ch 13(2); Ch 2; Ch 7; Ch 8; Ch 12(1); Ch 12(2); Ch 14; Ch 16; Ch 17; Ch 19; Ch 20(1); Ch 20(2)
Green, K & Pickering, C 2009, 'Vegetation, microclimate and soils associated with the latest-lying snowpatches in Australia', Plant Ecology & Diversity, vol. 2, no. 3, pp. 289–300 [dx.doi.org/10.1080/17550870903019275] Cited in: Ch 13
Keith, DA & Simpson, CC 2006, Spatial Data Layers for NSW Extant Native Vegetation, internal report, Department of Environment and Conservation NSW, Sydney. Cited in: Ch 13
Keith, DA & Simpson, CC 2008, 'A protocol for assessment and integration of vegetation maps, with an application to spatial data sets from south-eastern Australia', Austral Ecology, vol. 33, no. 6, pp. 761–74 [dx.doi.org/10.1111/j.1442-9993.2008.01844.x] Cited in: Ch 13
Laurence, WF, Dell, B, Turton, SM, Lawes, MJ, Hutley, LB, McCallum, H, Dale, P, Bird, M, Hardy, G, Prideaux, G, Gawne, B, McMahon, CR, Yu, R, Hero, J-M, Schwarzkopf, L, Krockenberger, A, Douglas, M, Silvester, E, Mahony, M, Vella, K, Saikia, U, Wahren, C, Xu, Z, Smith, B & Cocklin, C 2011, 'The 10 Australian ecosystems most vulnerable to tipping points', Biological Conservation, vol. 144, no. 5, pp. 1472–80 [dx.doi.org/10.1016/j.biocon.2011.01.016] Cited in: Ch 13
Nicholls, N 2009, 'Estimating changes in mortality due to climate change', Climatic Change, vol. 97, no. 1–2, pp. 313–20 [dx.doi.org/10.1007/s10584-009-9694-z] Cited in: Ch 13
OEH 2011, NSW Annual Report on Native Vegetation 2010, NSW Office of Environment and Heritage, Sydney [www.environment.nsw.gov.au/vegetation/reports.htm] Cited in: Ch 13
Saunders, D, Margules, C & Hill, B 1998, Environmental Indicators for National State of the Environment Reporting: Biodiversity, Department of the Environment, Canberra [www.environment.gov.au/soe/publications/indicators/biodiversity.html] Cited in: Ch 13