
Ground-level ozone – a key component of photochemical smog – remains an issue for Sydney and concentrations have generally exceeded national air quality standards on up to six days a year between 2012 and 2014.
There is growing evidence about the adverse health impacts of airborne particles. Particle pollution generally meets standards in Sydney, except when bushfires or dust storms occur. Such events mean that concentrations have exceeded national air quality standards on up to 18 days a year from 2012 to 2014. Some areas in regional NSW exceeded the particle standards on as many as 15 days a year over the same period, with bushfires, stubble burning, dust storms, coal mine dust and wood heaters as the major causes.
Related themes: 3 Energy consumption | 5 Greenhouse gas emissions
NSW indicators
| Indicator and status | Environmental trend |
Information availability |
|
|---|---|---|---|
| Concentrations of ozone | Stable | ✔ ✔ ✔ | |
| Concentrations of particles (PM10) | Stable | ✔ ✔ ✔ | |
| Concentrations of particles (PM2.5) | Stable | ✔ ✔ ✔ | |
| Concentrations of carbon monoxide | Stable | ✔ ✔ ✔ | |
| Concentrations of nitrogen dioxide | Stable | ✔ ✔ ✔ | |
| Concentrations of sulfur dioxide | Stable | ✔ ✔ ✔ | |
| Concentrations of lead | Stable | ✔ ✔ ✔ | |
Notes: Terms and symbols used above are defined in About SoE 2015 at the front of the report.
Context
Since the early 1990s, research has emerged about the adverse health effects of air pollution. Short-term exposure to elevated air pollutants exacerbates existing respiratory and cardiovascular problems and increases the risk of acute symptoms, hospitalisation and death (EPHC 2014). Repeated, long-term exposure increases the risk of chronic respiratory and cardiovascular disease and mortality, can impact birth weight, and can permanently affect lung development in children (WHO 2013b).
Further to its classification of diesel exhaust as a human carcinogen (WHO 2012), the International Agency for Research on Cancer has also classified outdoor air pollution as a human carcinogen (WHO 2013a).
The health costs of air pollution at 2005 levels in the Greater Metropolitan Region GMR2) were estimated to be $4.7 billion or $893 per head of population (DEC 2005). Across Australia’s capital cities motor vehicle pollution health costs have been estimated at $3.3 billion per year ($1.5 billion for Sydney) (BTRE 2005).
Australians spend an average 20 out of 24 hours a day indoors, largely in the home environment (enHealth 2012). As a result, health risks from personal exposure to airborne substances may be more closely related to the pollutants encountered indoors than those outdoors.
Status and trends
National standards and goals
In 1998, in order to help protect the health of Australians, the National Environment Protection Council (NEPC) set ambient air quality standards and goals for six key pollutants in the National Environment Protection (Ambient Air Quality) Measure (AAQ NEPM):
- ground-level ozone (O3)
- particles (as PM10)
- carbon monoxide (CO)
- nitrogen dioxide (NO2)
- sulfur dioxide (SO2)
- lead.
(The AAQ NEPM standards for particles SO2, NO2 and O3 are currently under review – see below.)
The AAQ NEPM goal for each pollutant sets the maximum number of days in which the relevant standard (a specified concentration of the pollutant) may be exceeded. To measure compliance with national goals, the NSW Government operates an extensive air quality monitoring network across the state (see ‘Responses’ below). NSW consistently meets the goals for carbon monoxide, nitrogen dioxide and sulfur dioxide; ozone and particles continue to be problematic.
Through ongoing research it has become clear that the smaller the particles the greater their potential impact (WHO 2013b). Because of this more detailed monitoring of very fine particles has been developed, with the AAQ NEPM being amended in 2003 to include two advisory reporting standards for PM2.5.
Lead monitoring was discontinued in 2004 following a decrease in ambient lead levels to well within the national standard, largely as a result of the introduction of unleaded petrol.
Ozone
Ozone is present in both the upper atmosphere (stratosphere) and the lower atmosphere (troposphere). The ‘ozone layer’ in the stratosphere protects all life forms by reducing the levels of the Sun’s damaging UV-B radiation reaching the Earth’s surface.
Stratospheric ozone is not a pollutant. In contrast, tropospheric (‘ground-level’) ozone is an air pollutant that is harmful to human health and the environment (WHO 1998).
In the troposphere ozone is formed when ‘precursor’ compounds – especially oxides of nitrogen (NOx) and volatile organic compounds (VOCs) – react in warm, sunny conditions. These precursors can be natural or human in origin. Bushfires, for example, can generate ozone directly too.
As elevated ozone concentrations tend to occur during warmer months, the current problems are likely to be exacerbated by future climate change (DECCW 2010).
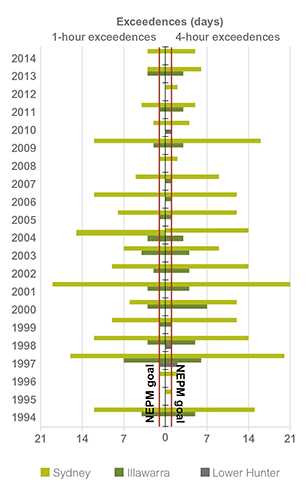
Figure 8.1: Exceedences of the AAQ NEPM standards for ozone in the GMR2, 1994–2014
Source: OEH data 2015
Note: A day is counted only once per region, even if exceedences occur at multiple monitoring sites on that particular day. GMR2 = Greater Metropolitan Region comprising Sydney, Illawarra and Lower Hunter regions. AAQ NEPM = Ambient Air Quality National Environment Protection Measure.
Data for Figure 8.1
While all parts of Sydney can experience ozone concentrations above the AAQ NEPM standards, the west and south-west of the city are the regions most often exposed as a result of summertime atmospheric circulation in the Sydney Basin (DECCW 2010).
The AAQ NEPM sets two standards for ozone: a one-hour standard of 0.10 parts per million (ppm) and a rolling four-hour standard of 0.08 ppm. The NEPM goal stipulates that by 2008 the maximum allowable number of exceedences for each standard is one day per year.
Between 2008 and 2014, the one-hour goals were met twice in Sydney: in 2008 and 2012 for the one-hour standard. Either or both of the standards have been exceeded in Sydney every year since 1996 (Figure 8.1). Between 1994 and 2014, ozone concentrations in Sydney exceeded the one-hour standard on up to 19 days per year. Over the same period, exceedences of the rolling four-hour standard occurred on up to 21 days.
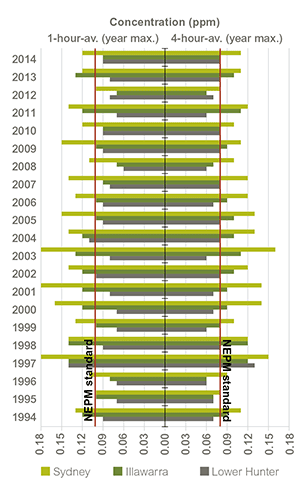
Figure 8.2: Annual maximum one-hour-average and four-hour-average concentrations for ozone in the GMR2, 1994–2014
Source: OEH data 2015
Note: GMR2 = Greater Metropolitan Region. AAQ NEPM = Ambient Air Quality National Environment Protection Measure.
Data for Figure 8.2
The standards were exceeded less frequently in the Illawarra during that period, occurring on up to seven days per year for both standards (Figure 8.1). Either or both of the AAQ NEPM ozone standards were exceeded in the Illawarra on more than one day in 1994, 1997, 1998, 2000–2004, 2009 and 2013. The Lower Hunter region recorded the fewest exceedences of the standards with neither standard being exceeded more than once a year (thus complying with the AAQ NEPM) since 1997.
Figure 8.2 shows the maximum recorded concentrations of ozone for each region from 1994 to 2014. These have been highest in Sydney and lowest in the Lower Hunter.
A statistical analysis to filter out most of the meteorological variability shows ozone concentrations in Sydney are not decreasing (see Figure 2.3 in SoE 2012 (EPA 2012a)).
Bushfire events and hazard reduction burns are potentially significant sources of ozone precursors and can have an impact on ozone pollution; plus many of the weather conditions that lead to high bushfire danger are also conducive to the formation of ozone. Importantly, burning causes at most 20–25% of exceedences; so even without bushfires, emissions from human activities are sufficient to cause infrequent exceedences of the AAQ NEPM standards at one or more monitoring stations in the region on a given day (DECCW 2010).
Particles
Particles smaller than 10 micrometres (µm) in diameter (PM10) are associated with increased mortality and hospital admissions for people with both heart and lung disease. Health research identifies particles smaller than 2.5 µm (PM2.5) as of particular concern. These can be inhaled more deeply into the lungs. As well as causing respiratory irritation, some are small enough to pass into the bloodstream where (even at relatively low levels) they can trigger heart attacks in people with existing health conditions and impact more severely on children and the elderly (WHO 2013a).
Particle concentrations are monitored across the GMR2, as well as in Albury (NSW–Victoria border), Bathurst (Central Tablelands), Tamworth (North-West Slopes) and Wagga Wagga (South-West Slopes). Levels recorded in these centres are generally representative of the air quality in the surrounding regions.
The concentrations and sizes of airborne particles can vary greatly between sources, regions and seasons. In the GMR2, as well as in Albury, Bathurst and Tamworth, the majority of exceedences occur in spring and summer, as bushfires and dust storms are more prevalent. In Wagga Wagga exceedences are most common in autumn.
Large-scale dust storms, whilst uncommon, can result in widespread and extreme levels of particles, for example in 2003 and 2009 (observable in Figure 8.4; see discussion in SoE 2012).
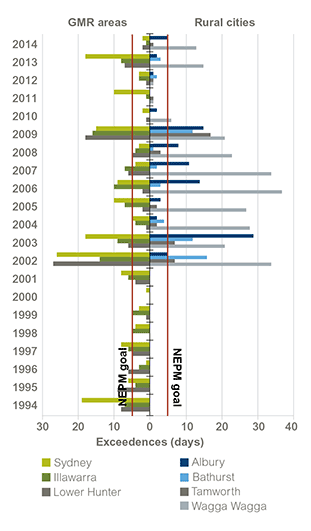
Figure 8.3: Exceedences of the AAQ NEPM standard for particles (PM10) in the GMR2 (1994–2014) and NSW rural cities (2002–14)
Source: OEH data 2015
Notes: GMR2 = Greater Metropolitan Region comprising Sydney, Illawarra and Lower Hunter regions. AAQ NEPM = Ambient Air Quality National Environment Protection Measure
Data for Figure 8.3
PM10: Across the GMR2 the national standard for PM10 is being met the majority of the time. Numbers of exceedences vary greatly from year to year (Figure 8.3), often in associated with bushfires or dust storms, for example:
- bushfires in 1994 and 2001–2003
- major statewide dust storms in September 2009
- hazard reduction burns in 2011
- NSW bushfire emergency in late 2013
- construction activity close to sampling stations.
The national goal of no more than five PM10 standards exceedences per year is regularly not being met.
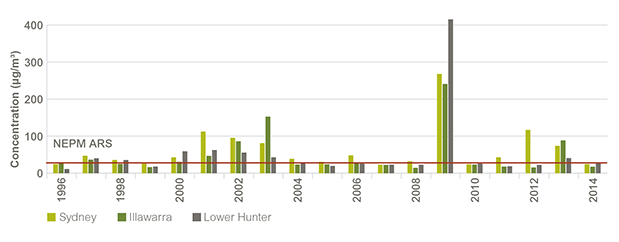
Figure 8.4: Annual maximum 24-hour-average concentrations for particles (PM2.5) in the Greater Metropolitan Region, 1996–2014
Source: OEH data 2015
Notes: NEPM ARS = National Environment Protection (Ambient Air Quality) Measure Advisory Reporting Standard.
Data for Figure 8.4
The rural cities also have problems with particles. In 2003 and 2009, none of the four met the PM10 goal (Figure 8.3). Albury, Bathurst and Tamworth have achieved the goal in some of the years shown, while Wagga Wagga has met the goal in only two, particularly wet, years – 2011 and 2012. Dust storms, bush fires and drought-related factors have contributed to the general run of high exceedences in earlier years.
PM2.5: The AAQ NEPM was amended in 2003, adding two advisory reporting standards for PM2.5 – a 24-hour average of 25 µg/m3 and an annual average of 8 µg/m3.
In NSW measured PM2.5 concentrations have generally been at or below the 24-hour-average standard but above the annual average standard. The PM2.5 24-hour maxima (Figure 8.4) show similar drought and bushfire influenced patterns to those of the PM10 levels.
Other AAQ NEPM pollutants
NSW consistently complies with the national air quality standards for the other AAQ NEPM air pollutants: carbon monoxide, nitrogen dioxide, sulfur dioxide and lead (these are detailed in SoE 2000 (EPA 2000).
As motor vehicles, fuels and industries have improved, nitrogen dioxide and sulfur dioxide levels less than 25–75% of their standards are usual (helping reduce acid precipitation). Leaded fuel, the primary source of lead in air at the regional scale has also been eliminated, and carbon monoxide levels are now generally only found to be elevated where traffic density is high and dispersion poor.
Air Toxics NEPM pollutants: The Air Toxics NEPM covers five air toxics: benzene, toluene, xylenes, formaldehyde and benzo(α)pyrene (BaP). The most recent monitoring (see Air Toxics NEPM pollutants in SoE 2012) shows that BaP levels were the most significant of all air toxics measured, but still only about 65% of the NEPM monitoring investigation level.
There can be occasions where incidents, such as equipment failure or fire, can result in harmful emissions of air toxics to the environment.
Indoor air quality
A range of building fixtures and fittings, indoor activities, and even the fabric of a building contribute emissions that can pollute indoor air. In addition, ambient air pollution – particularly fine particles and gases – infiltrates indoor spaces, affecting indoor exposure (see previous SoE reports for details, e.g. Indoor air quality in SoE 2012).
Monitoring in NSW homes has identified secondary tobacco smoke and emissions from solid-fuel heaters (e.g. wood heaters) and unflued gas heaters as key contributors to poor air quality – especially carbon monoxide, nitrogen dioxide and fine particles (Sheppeard et al. 2002; DEH 2004).
Unflued gas heaters remain the primary form of heating in about 18% of homes in NSW (CE&R 2008). In 2014, 10.2% of NSW homes used solid fuel heaters as their main source of heat (ABS 2014), compared to 13.7% in 2008.
Secondary tobacco smoke remains an important factor in indoor air quality.
Pressures
Variations in monitored pollutant levels
Ozone precursors and particles
The pollutants of ongoing concern for NSW air quality are fine particles, and the main precursors for ozone.
While the most important human-related causes of air pollution largely arise from businesses and industries licensed by the NSW Environment Protection Authority (EPA), as well as road and non-road transport and household activities, their significance varies between urban and rural/regional areas. On the other hand, natural causes of air pollution, such as bushfires and hazard reduction burns, windborne dust from exposed land, sea spray and vapours from grasses, plants and trees can also contribute to poor air quality. Once in the air, some pollutants undergo further chemical reactions and can be transported by air movement across regions.
Every five years, the EPA conducts an intensive investigation into air pollution emissions by source type across the GMR3 (covering about 75% of the NSW population). The 2013 calendar year air emissions inventory is anticipated to be released in 2016.
According to the 2008 Air Emissions Inventory for the Greater Metropolitan Region of NSW (EPA 2012b) (see discussion in SoE 2012), from 1992 to 2008, air emissions steadily decreased in the Sydney region, with oxides of nitrogen decreasing by 27%, volatile organic compounds (VOCs) by 40% and PM10 by 20%. These declines occurred despite increases in key NSW statistics over the same period, such as:
- gross state product increased by 68%
- vehicle kilometres travelled increased by 26%
- population grew by 18%.
The decrease seen in oxides of nitrogen and VOCs in the Sydney region is largely due to mandated emission standards for road transport and improved identification and control of emissions from EPA-licensed industry.
In contrast, emissions of oxides of nitrogen steadily increased by 32% across the GMR3. This reflects energy consumption (mostly supplied from coal-fired power stations in rural/regional areas) increasing by 28% between 1992 and 2008. Emissions of PM10 have risen by 48%, largely due to increased coal mining. VOC emissions in the GMR3 decreased by 6%.
As well as being the largest source of particles in the Sydney region, wood smoke contains air pollutants such as carbon monoxide, oxides of nitrogen, and a range of organic compounds, some of which (e.g. benzo(α)pyrene and benzene) are toxic or carcinogenic.
Air toxics
A key source of air toxics included in the air emissions inventory includes EPA-licensed industry. The Protection of the Environment Operations Act 1997 (POEO Act) and regulations include requirements for preventing and/or minimising air toxics from these premises.
Climate change pressures
Research into the relationship between global emissions of greenhouse gases (see Theme 5: Greenhouse gas emissions), climate change and air quality is ongoing (e.g. see Adapt NSW, also: Cope et al. 2008; DECCW 2010; Jacob & Winner 2008; Lacressonnière et al. 2014; Pfister et al. 2014; Walsh 2008). Whilst some forms of emission may decrease (e.g. from wood heaters), chemical and temperature changes in the atmosphere will most likely lead to key air pollutants increasing, influencing the formation of ozone and secondary particles (PM2.5).
Population pressures
Increased development in urban centres can expose more people to elevated concentrations of air pollutants. In the Sydney basin, the growing populations in areas in the southwest, west and northwest may be especially affected by elevated ozone – due to both the atmospheric conditions in those areas being conducive to ozone formation, and due to increased population generating increased emissions of precursors. This increased exposure risk may also be compounded by the greater vulnerability of sensitive populations arising from an aging demographic.
Increased development at the interface with natural bushland also has the potential to increase population exposure to the effects of smoke from bushfires and hazard reduction burns. Similarly, increased development along urban transport corridors has the potential to increase population exposure to emissions.
There is also pressure on air quality for urban and regional centres associated with the expansion of mining activities and ports.
Responses
Continued improvement in managing air quality is a priority for the NSW Government, as is informing and engaging the public on air quality issues. This involves maintaining and expanding monitoring networks, maintaining and making accessible air emissions inventory information and conducting research and regional airshed modelling to provide a sound evidence base for implementing air quality policies and programs. The provision of current air quality monitoring information and air pollution forecasts and alerts to the public also allows communities to be aware of local air quality and engage in informed discussions on air quality issues. It also enables people to manage their exposures.
The monitoring network continues to provide up-to-date air quality information to the community through the Office of Environment and Heritage (OEH) website, which links through to a system of email and SMS health alerts for high pollution days. Air quality information is also routinely reported within NSW annual air quality statements and NSW annual NEPM compliance reports. These are available on the OEH website.
Controlling particle emissions
In December 2013, the EPA released Managing Particles and Improving Air Quality in NSW (EPA 2013). This publication details current management of particles pollution in NSW along with a set of principles and actions to reduce particle emissions.
Particle characterisation studies
The NSW Government has been investigating sources of particle emissions in Sydney and in the upper and lower Hunter.
The Sydney Particle Study (2010–13) found that organic matter (in both autumn and summer) and sea salt (in summer) were significant sources of PM2.5. Major sources of secondary organic particles in the air include VOCs from vegetation in summer and wood heaters in autumn.
In September 2013, OEH and NSW Health reported the results of the Upper Hunter Fine Particle Characterisation Study (Hibberd et al. 2013), prepared by CSIRO and the Australian Nuclear Science and Technology Organisation (ANSTO). The study found that dominant sources contributing to PM2.5 concentrations in Muswellbrook and Singleton include wood smoke, vehicle and industry emissions (such as emissions of sulfur dioxide, and nitrogen dioxide emissions from power stations). PM2.5 levels were higher in winter, due to wood fires used for residential heating.
The Lower Hunter Particle Characterisation Study air sampling program was completed in February 2015. Four sites were investigated: Newcastle and Beresfield (PM2.5); and Mayfield and Stockton (PM2.5 and, in response to community input, PM10). Results are expected to be published in 2016.
Controlling transport emissions
In the Sydney region, transport is a significant source of ozone precursor emissions (NOx and VOCs), as well as particulates and particulate precursors.
Key initiatives by NSW are to make fuels and vehicles cleaner, and deliver cleaner freight and passenger transport options to reduce emissions, and improve health and liveability.
Vapour recovery (VR1 and VR2)
Emissions of VOCs from service station operations represent about 1–2% of total VOC emissions in the GMR3.
- VR Stage 1 (managing the filling of underground storage tanks from road tankers) has been completed for the majority of service stations in Sydney, Wollongong, Newcastle and the Central Coast
- VR Stage 2 (capture of emissions from vehicle petrol tanks during refuelling) has commenced at large petrol stations. Most of the smaller stations in Sydney are required to be upgraded by 2017.
Summer petrol volatility
From 15 November to 15 March each year the volatility of petrol supplied in Sydney is limited to 62 kilopascals, with petrol importers and blenders required to test batch volatility and report to the EPA.
Controlling industrial emissions
The POEO Act, the POEO (Clean Air) Regulation 2010 and POEO (General) Regulation 2009 set the framework for managing air pollution from major industry in NSW. These controls will also help reduce localised emissions of air toxics.
Best practice measures for controlling emissions from coal mining
In recent years, mining and transport of coal have been a key focus of regulatory activities. Through the Dust Stop Pollution Reduction Program, all operating coal mines in NSW had pollution reduction programs attached to their environment protection licences.
From March 2013, licensees were required to undertake site-specific best management practice reviews and to implement the findings. Implementation has succeeded in mines achieving an estimated 80% control of wheel generated dust – reducing annual particulate emissions by about 20,000 tonnes. Mines have also investigated best practice measures designed to reduce emissions from overburden operations.
In 2014, the EPA introduced another pollution reduction program to require all open cut mines to report on the area of land exposed to wind erosion and is reviewing the mines’ responses in terms of changing operations during adverse weather. The EPA is also investigating approaches to reduce diesel emissions from machines used at coal mines.
Compliance audit of coal train loading and unloading facilities
The EPA conducted a compliance audit program of licensed coal loading and unloading premises (EPA 2014) and is requiring the audited facilities to rectify identified non-compliances. Individual facility audit reports are available on the EPA public register.
Assessment and control of air quality impacts from licensed activities
When development applications are submitted to government, the EPA helps to assess, provide advice and place conditions on the development and operation of activities licensed under the POEO Act.
Reducing diesel and marine emissions
From 2011 to 2014, the EPA ran the Clean Machine Program, which supported diesel emission reductions from non-road diesel machines (e.g. plant and equipment such as cranes and gantries, bulldozers, loaders, graders, and tractors) by promoting procurement of lower emitting equipment and better worksite practices, and by subsidising retrofitting of heavily polluting machines with exhaust emissions after-treatment devices (diesel particle filters).
Whereas merchant shipping activities tend to take place in the industrial ports, which are often close to industrial areas, cruise ships mostly use facilities in closer proximity to urban areas. As bunker fuel used by such ships tends to have a high sulfur content, exhaust emissions have been impacting communities close to cruise ship terminals.
Recent amendments to the Clean Air Regulation will require:
- use of low sulfur fuel (0.1% or less) by cruise ships while berthed in Sydney Harbour from 1 October 2015
- use of low sulfur fuel (0.1% or less) by cruise ships while in Sydney Harbour from 1 July 2016.
The regulation amendment focuses on Sydney Harbour because cruise ship visits to Sydney Harbour constitute over 90% of all such visits to NSW ports. Further consultation will be undertaken with local communities in regional NSW ports before considering any broader application of these requirements.
Following the Clean Machine Program, the EPA released its Diesel and Marine Emissions Management Strategy (EPA 2015) in February 2015. It aims to improve air quality and public health in NSW by reducing harmful emissions from non-road diesel and marine sources, such as shipping, equipment used in coal mines, locomotives, and industry activities licensed by the EPA.
Controlling commercial and domestic emissions
The NSW Government has implemented a number of policies focused on the domestic-commercial sector as it is a significant contributor to air pollution in NSW. Many of these issues are managed by, or in conjunction with, local government.
Wood smoke management program
The EPA administers the wood smoke laws in NSW and works with industry, other Australian jurisdictions and the Commonwealth to improve standards for heating appliances. Wood heaters offered for sale must meet emission standards, enforced through periodic EPA audit programs.
The EPA also supports councils across NSW in managing wood smoke. The 2014 Wood Smoke Reduction Program provided councils with grants of over $1 million for community education programs, rebates for cleaner forms of heating and smoky chimney surveys.
To help reduce the release of air toxics, under the POEO (Clean Air) Regulation 2010, it is illegal in NSW to burn wood preservative-treated timber (such as copper chrome arsenate (CCA) and pentachlorophenol (PCP)).
The EPA continues to explore new regulatory and non-regulatory environmental measures to control wood smoke. In March 2015 the EPA released a proposed regulatory amendment to the 2010 Clean Air Regulation for consultation. The proposed amendment incorporates recent changes to national standards for wood heaters and a new schedule of wood heater installation approval controls that local councils can elect to adopt.
Air Emissions in My Community web tool
In 2013 the EPA released the Air Emissions in My Community web tool. The tool presents aggregated data and charts for different geographic areas down to council and postcode level, to provide community access to information and understanding of air pollution sources in local areas.
Managing indoor air quality
Tobacco smoke
The NSW Tobacco Strategy 2012–2017 (NSW Ministry of Health 2012) provides an overarching framework for reducing smoking and tobacco related harm in NSW. Smoking bans in NSW now comprise all enclosed public areas and certain public outdoor areas, as well as in motor vehicles in the presence of under-16 year olds. From July 2015, smoking bans also cover commercial outdoor dining areas. In NSW nine out of 10 adults now live in a smoke free home.
Heating in homes and schools
By 2011, under the NSW Gas Heater Replacement Program, all ‘hi-NOx’ unflued gas heaters in NSW schools had been replaced with ‘low-NOx’ units (around 51,000 heaters). From 2012 onwards, all new NSW schools and school buildings built since 2012 are fitted with flued gas heaters. Maintenance of existing unflued heaters will continue, but once heaters reach the end of their serviceable life, and a school requires a heating upgrade, all unflued gas heaters in that school will be replaced with flued gas heaters.
Solid fuel heating
See ‘Wood smoke management program’.
Legionnaires’ disease
The Public Health Regulation 2012 (updating the regulation from 2000) is the current legislation regarding control for Legionnaires’ and other diseases.
Home maintenance
Information about asbestos, lead paint, and accumulated contaminated dusts and other materials that can be disturbed during home maintenance is provided on the DIY Safe, Asbestos Awareness, and the Heads of Asbestos Coordination Authorities websites.
Supporting climate change strategies
Air pollution and climate change may affect each other, so policy responses can be interlinked. For example, weather conditions influence the formation of ozone and secondary particles, and changes to weather conditions due to climate change are likely to increase formation rates of these pollutants. Another example is the transport and energy sectors, which are both key sources of greenhouse gases; policies to address greenhouse gas emissions (e.g. improving energy efficiency and increasing renewable energy usage) can also have significant benefits in reducing other emissions (see also responses in Theme 3: Energy consumption, and Theme 5: Greenhouse gas emissions).
Monitoring and reporting air quality
The air quality monitoring network comprises 43 multi-parameter monitoring sites across NSW. Twenty-two sites are located in Sydney, the Illawarra, the Central Coast and Lower Hunter regions. There are four sites in regional NSW that measure particles only. The Upper Hunter network (14 sites) and three supplementary sites in the Lower Hunter are industry-funded, but reported by OEH as part of the network. Industry has funded these 17 sites in addition to the monitoring required of individual operators under their environment protection licences.
Improving presentation and communication of air quality data
Monitoring stations are ‘live-linked’ to the NSW Government’s air quality information system. This allows increased access to current and historical data, better online mapping, and hourly updates of the air quality index for each station and region. The index is now based on six pollutants and reports six categories – very good, good, fair, poor, very poor and hazardous. There is also a subscription service available to the public (via SMS and email) which allows users to receive air pollution forecasts and various alerts (e.g. health alerts due to high pollution).
National and interjurisdictional responses
In 2014, on the matter of PM2.5, the NEPC released an impact statement and draft variation to the AAQ NEPM particle standards for public consultation (EPHC 2014). This review is being led by NSW, in consultation with other jurisdictions.
In April 2014 Australian environment ministers agreed to develop a national clean air agreement to address the challenges facing air quality. The agreement will focus actions to reduce air pollution and improve air quality through cooperative action between industry and government at the national, state and local level. Under the agreement, governments will work to develop emission control measures for wood heaters and non-road spark ignition engines and equipment, and agree to strengthen reporting standards for particulate matter under the AAQ NEPM.
Possible new emission control measures to be considered under the agreement include measures to address mercury releases into the environment and jurisdictional initiatives to reduce localised non-road diesel engine emissions and shipping emissions.
Cleaner vehicles, fuels and engines
Following agreement with the states, the Australian Government has introduced Euro 5 and Euro 6 standards for limiting exhaust emissions from light vehicles (all new cars, four-wheel drives and commercial vehicles less than 3500 kg gross vehicle mass) (Regulation (EC) No. 715/2007 of the European Parliament). The Euro 5 emission standard (as Australian Design Rule ADR79/03 & 04) will be phased in from November 2013 for new model vehicles (excluding the particle number limit for diesel vehicles). Full compliance with Euro 5 for all new vehicles is required by November 2016. Compliance with Euro 6 (ADR 79/05) will be phased in from 1 July 2017; by 1 July 2018, all new light vehicles sold in Australia will need to meet the higher standard.
National Indoor Air Project
The former Australian Department of Sustainability, Environment, Water, Population and Communities, in conjunction with the CSIRO, published the findings of the Indoor Air Project in 2010 (CAWCR 2010).
As Australia doesn’t have guidelines for indoor air quality, definitive rating of the study’s results weren’t produced. However, the concentrations of indoor air pollutants observed were similar to or lower than those observed in previous studies. Other findings included:
- on average, for every 31 days of observations there would be one day where indoor PM2.5 exceeded the advisory reporting standard set for outdoor air
- patterns of elevated NO2 concentrations were linked to the use of unflued combustion heaters as well as proximity to busy roads
- ozone concentrations were lower indoors than outdoors, in part due to Australian dwellings generally having limited indoors sources of ozone and the efficiency of furniture and the building fabric in removing ozone from the air.
Building rating schemes
The National Australian Built Environment Rating System (NABERS) provides tools to rate the environmental impact of commercial building operations using third party verified data, such as utility bills or on-site measurements. It is administered by OEH.
There are ratings to measure the energy and water efficiency, waste management and indoor environment quality of offices, energy and water tools for shopping centres and hotels, and an energy tool for data centres.
NABERS indoor environment ratings include a measurement of indoor air quality, thermal comfort, lighting, office layout and occupant satisfaction. As at 30 June 2015, there have been 38 NSW buildings certified with NABERS indoor environment ratings.
The Green Building Council of Australia introduced Green Star in 2003, providing design, as-built, and performance ratings for buildings.
Future opportunities
Building codes and standards
There is growing interest in controlling areas such as building construction materials and management of indoor air quality at the design stage, e.g. via new building code rules.
Emissions from domestic appliances and surfaces, furnishings and consumer products are also areas of potential investigation.
References
ABS 2014, Environmental Issues: Energy Use and Conservation, Mar 2014, cat. no. 4602.0.55.001, Australian Bureau of Statistics, Canberra [www.abs.gov.au/ausstats/abs@.nsf/mf/4602.0.55.001] Cited in: Ch 8
BTRE 2005, Health Impacts of Transport Emissions in Australia: Economic costs, Working Paper No.63, Bureau of Transport and Regional Economics, Department of Transport and Regional Services, Canberra [www.bitre.gov.au/publications/2005/wp_063.aspx] Cited in: Ch 8
CE&R 2008, The Health of the People of New South Wales: Report of the Chief Health Officer, Centre for Epidemiology and Research, NSW Department of Health, Sydney Cited in: Ch 8
Cope, ME, Lee, S, Physick, B, Abbs, D, Nguyen, K & McGregor, J 2008, A Methodology for Determining the Impact of Climate Change on Ozone Levels in an Urban Area, report by the Commonwealth Scientific and Industrial Research Organisation, Division of Marine and Atmospheric Research, Aspendale, Victoria for the Department of the Environment, Water, Heritage and the Arts (Clean Air Research Program), Canberra [www.environment.gov.au/atmosphere/airquality/publications/climate-change.html] Cited in: Ch 8
CAWCR 2010, Indoor Air Project – Indoor Air in Typical Australian Dwellings, a report to the Air Quality Section, Environment Standards Branch, Department of the Environment, Water, Heritage and the Arts, Centre for Australian Weather and Climate Research, Canberra [www.environment.gov.au/resource/indoor-air-project] Cited in: Ch 8
DEC 2005, Air Pollution Economics: Health costs of air pollution in the Greater Sydney Metropolitan Region, Department of Environment and Conservation NSW, Sydney [www.environment.nsw.gov.au/aqms/airqualityresearch.htm] Cited in: Ch 8
DECCW 2010, Current Air Quality in New South Wales: A technical paper supporting the Clean Air Forum 2010, Department of Environment, Climate Change and Water NSW, Sydney [www.environment.nsw.gov.au/air/cpairqual.htm] Cited in: Ch 8(1); Ch 8(2); Ch 8(3); Ch 8(4)
DEH 2004, Unflued Gas Appliances and Air Quality in Australian Homes, Technical Report No.9, Department of the Environment and Heritage, Canberra [www.environment.gov.au/atmosphere/airquality/publications/report9/index.html] Cited in: Ch 8
enHealth 2012, Australian Exposure Factor Guide, Australian Environmental Health Committee, Canberra [www.health.gov.au/internet/main/publishing.nsf/content/health-pubhlth-publicat-environ.htm] Cited in: Ch 8
EPA 2000, NSW State of the Environment 2000, NSW Environment Protection Authority, Sydney Cited in: Ch 8
EPA 2012a, New South Wales State of the Environment 2012, NSW Environment Protection Authority, Sydney [www.epa.nsw.gov.au/soe/soe2012] Cited in: Ch 8; Ch 2; Ch 7; Ch 12(1); Ch 12(2); Ch 13(1); Ch 13(2); Ch 14; Ch 16; Ch 17; Ch 19; Ch 20(1); Ch 20(2)
EPA 2012b, 2008 Calendar Year Air Emissions Inventory for the Greater Metropolitan Region in NSW, NSW Environment Protection Authority, Sydney [www.epa.nsw.gov.au/air/airinventory2008.htm] Cited in: Ch 8
EPA 2013, Managing particles and improving air quality in NSW, NSW Environment Protection Authority, Sydney [www.epa.nsw.gov.au/air/20130784ManPartStr.htm] Cited in: Ch 8
EPA 2014, Compliance audit of coal train loading and unloading facilities, NSW Environment Protection Authority, Sydney [www.epa.nsw.gov.au/licensing/complianceaudit.htm] Cited in: Ch 8
EPA 2015, Diesel and marine emissions management strategy, NSW Environment Protection Authority, Sydney [www.epa.nsw.gov.au/air/150038DieselStrategy.htm] Cited in: Ch 8
EPHC 2014, Draft Variation to the National Environment Protection (Ambient Air Quality) Measure – Impact Statement, National Environment Protection Council, Canberra [www.environment.gov.au/protection/nepc/nepms/ambient-air-quality/variation-2014/impact-statement] Cited in: Ch 8(1); Ch 8(2)
Hibberd, MF, Selleck, PW, Keywood, MD, Cohen, DD, Stelcer, E & Atanacio, AJ 2013, Upper Hunter Particle Characterisation Study, CSIRO, Aspendale, Victoria [www.environment.nsw.gov.au/aqms/uhaqmnfpcs.htm] Cited in: Ch 8
Jacob, D & Winner, D 2008, ‘Effect of climate change on air quality’, Atmospheric Environment, 43(1), pp. 51–63 [dx.doi.org/10.1016/j.atmosenv.2008.09.051] Cited in: Ch 8
Lacressonnière, G, Peuch, V-H, Vautard, R, Arteta, J, Déqué, M, Joly, M, Josse, B, Marécal, V & Saint-Martin, D, 2014, European air quality in the 2030s and 2050s: Impacts of global and regional emission trends and of climate change, Atmospheric Environment, 92, pp. 348–358 [dx.doi.org/10.1016/j.atmosenv.2014.04.033] Cited in: Ch 8
NSW Ministry of Health 2012, NSW Tobacco Strategy 2012–2017, NSW Ministry of Health, North Sydney [www.health.nsw.gov.au/tobacco/Pages/nsw-tobacco-strategy.aspx] Cited in: Ch 8
Pfister, GG, Walters, S, Lamarque, J-F, Fast, J, Barth, MC, Wong, J, Done, J, Holland, G & Bruyère, CL, 2014, Projections of future summertime ozone over the U.S., Journal of Geophysical Research: Atmospheres, 119(9), pp. 5559–5582 [dx.doi.org/10.1002/2013JD020932] Cited in: Ch 8
Sheppeard, V, Corbett, SJ & Morgan, G 2002, ‘Indoor air pollution in New South Wales’, Proceedings of the 16th International Clean Air and Environment Conference, Clean Air Society of Australia and New Zealand, 19–23 August, Christchurch Cited in: Ch 8
Walsh, S 2008, Climate Change and Ozone Project: Stage 1 project report, internal Environment Protection Authority Victoria report, May 2008 Cited in: Ch 8
WHO 1998, Urban Traffic Pollution, Schwela, D and Zali, O (eds), World Health Organization, Spon Press, Routledge, London Cited in: Ch 8
WHO 2012, Media Release No. 213, IARC: Diesel Engine Exhaust Carcinogenic, International Agency for Research on Cancer, World Health Organization, Lyon, France [www.iarc.fr/en/media-centre/pr/2012] Cited in: Ch 8
WHO 2013a, Media Release No. 221, IARC: Outdoor air pollution a leading environmental cause of cancer deaths, International Agency for Research on Cancer, World Health Organization, Lyon, France [www.iarc.fr/en/media-centre/pr/2013] Cited in: Ch 8(1); Ch 8(2)
WHO 2013b, Review of evidence on health aspects of air pollution – REVIHAAP project: final technical report, World Health Organization, WHO Regional Office for Europe, Copenhagen [www.euro.who.int/en/health-topics/environment-and-health/air-quality/publications/2013/review-of-evidence-on-health-aspects-of-air-pollution-revihaap-project-final-technical-report] Cited in: Ch 8(1); Ch 8(2)