
Commercial and industrial waste is close to achieving the 2014 target recycling rate of 63%. Construction and demolition waste has increased with the uplift in the housing market, a large-scale infrastructure project, and the amount of this waste being recycled fell to 69%.
The NSW Government’s Waste Less, Recycle More initiative provides funding to improve business recycling, managing problem wastes, new waste infrastructure, and programs to tackle illegal dumping and litter.
Post-campaign research on the Hey Tosser! anti-litter campaign has indicated that the program has helped change attitudes to litter and litterers, and litter in NSW is reducing faster than the national average.
Related themes: 1 Population | 2 Economics and the environment
NSW indicators
| Indicator and status | Environmental trend |
Information availability |
|
|---|---|---|---|
| Total waste generation | Increasing impact | ✔ ✔ | |
| Per person waste generation | Stable | ✔ ✔ | |
| Total and per person solid waste disposal | Decreasing impact | ✔ ✔ | |
| Total and per person solid waste recycled | Decreasing impact | ✔ ✔ | |
| Litter items per 1000 m2 | Decreasing impact | ✔ ✔ ✔ | |
Notes: Terms and symbols used above are defined in About SoE 2015 at the front of the report.
Context
Improper management of waste presents issues for the environment, the economy and the community. Impacts of waste include odour, noise, dust, greenhouse gas emissions and harm to flora and fauna. Hazardous wastes can cause serious health problems, significant pollution and the leaching of toxins or nutrients into groundwater and land. Litter and illegal dumping are anti-social behaviours that reduce the amenity of public spaces. Landfill facilities remove space from the community and may compromise the use of land in the future.
The economy depends on the environment and natural resources to provide raw materials and absorb the waste and emissions we produce. Recycling such raw materials, keeps them in the productive economy for longer. This has the dual benefit of lowering demand for new resources and reducing the need to dispose, treat or manage waste.
In 2012, the cost to Australian businesses (excluding mining and agriculture) of managing their generated waste was about $2.2 billion. In addition, businesses spent about $24.3 billion on materials that were discarded as part of the creation of a product. For NSW businesses, this equates to about $825 million for disposal and recycling services and about $7.8 billion in waste materials every year (EPA 2014b).
Status and trends
Waste data areas
Changes to waste regulation have influenced the way waste data has been collected since SoE 2012 (EPA 2012). Waste data is now reported based on the:
- Metropolitan Levy Area (MLA) – as an amalgamation of the former Sydney Metropolitan Area and the former Extended Regulated Area comprising the Hunter, Central Coast and Illawarra regions
- ‘rest of NSW’ (as an amalgamation of the former Regional Regulated Area and the former Non-Regulated Area), that is, the area outside of the MLA.
Waste data for the ‘rest of NSW’ is unavailable prior to 2010–11. The data from 2010–11 onwards is not as good as that for the MLA, as it does not comprehensively cover all issues and it is based on voluntary surveys. The data has been included as a starting point, with improved data collections expected in future SoE reports, following the implementation of mandatory reporting from resource recovery facilities from 2015 onwards.
Waste disposal rates and trends per person
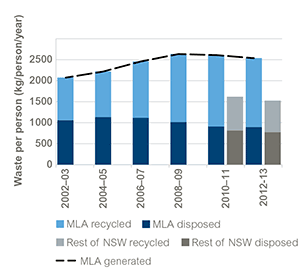
In 2012–13, per person waste generated in the MLA was 22% higher than the base year of 2002-03, but 3% lower than in the previous reporting period of 2010–11 (see Figure 7.1).
The waste disposal per person in the MLA represented 51% of the waste generated in 2002–03, compared with 35% in both 2010–11 and 2012–13. This continues the trend reported in SoE 2012 where waste disposed per person was decreasing. Figure 7.1 also shows the flipside to this trend, with the amount of waste recycled per person becoming an increasing proportion of waste generated. These trends are due to the significant increase in recycling capacity which has been absorbing any additional waste generated and reducing the amount of waste sent to landfill (EPA 2014b). There has been a 73% increase since 2002-03 in people who have access to a council garden organic kerbside service and 17% increase in people who have access to a council dry recycling kerbside service.
Figure 7.1: Per person waste recycled, disposed and generated
Source: EPA data 2015
Note: MLA = Metropolitan Levy Area.
Data for Figure 7.1
Total waste disposal rates and trends per waste stream
NSW collects data and initiates programs to manage three distinct waste streams:
- municipal waste – includes household and other council waste and predominantly consists of materials such as paper, garden and kitchen waste
- construction and demolition (C&D) waste – is mostly inert materials such as timber, bricks, plaster, offcuts, concrete, rubber, steel and excavated earth
- commercial and industrial (C&I) waste – contains relatively higher proportions of metals, plastics and timber than other forms of waste.
The NSW Waste Avoidance and Resource Recovery Strategy 2007 (WARR Strategy) (DECC 2007) set targets for increasing recycling in the three regulated waste streams by 2014. The targets were: 66% for municipal waste, 63% for C&I waste, and 76% for C&D waste (Table 7.1).
The NSW recycling rates across all waste streams have grown steadily since 2002–03, when WARR Strategy targets were first established, but is holding steady since the last progress report.
NSW has implemented programs to reduce waste to landfill, and increase recycling. To reach the targets in 2014, NSW recycling needed to increase by approximately 19% in municipal, 4% in C&I and 11% in C&D, provided that generation and disposal remained constant.
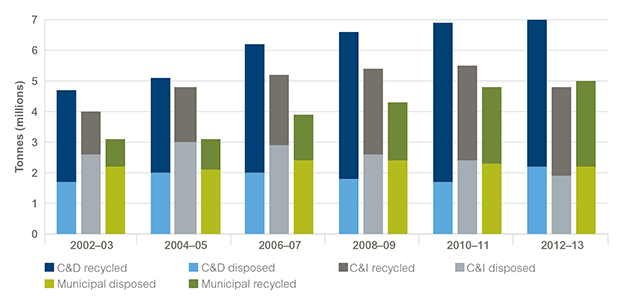
Waste stream data shows that between 2002–03 and 2012–13, the amount of C&D waste and municipal waste generated has increased at a substantially greater rate than C&I waste (Figure 7.2). This is likely due to the influence of the two main drivers for waste generation: population growth, (see Theme 1: Population) which has historically heavily impacted municipal waste generation; and economic growth (see Theme 2: Economics and the environment) which has been closely correlated with activity in the building industry which is itself correlated with generation of C&D waste.
Total waste generated across NSW is 42% higher in 2012–13 as compared with the base year, but has seen a drop of 2.3% since 2010–11, which is consistent with the trend depicted in Figure 7.1.
In 2012–13, NSW recycled 10.5 million tonnes of all waste categories compared with 5.3 million tonnes in 2002–03 (Figure 7.2). However, there are several factors that may affect this trend in the future, and which may account for the slight drop in total recycling rates between 2010 and 2012 (Figure 7.2). Recovered resources are often competing in global markets against virgin resources. Volatility in commodity prices for oil, iron ore, steel, etc. can have a flow on impact to the prices and demand for recycled materials such as plastics, scrap steel and paper. These global markets are also affected by increasing supply in other countries and fluctuations in the Australian dollar.
Table 7.1: Progress towards the NSW recycling targets, by waste stream
| Waste stream | 2002–03* | 2004–05 | 2006–07 | 2008–09 | 2010–11 | 2012–13 | 2014 recycling target |
|---|---|---|---|---|---|---|---|
| Municipal | 31% | 33% | 38% | 44% | 52% | 55% | 66% |
| C&I | 34% | 38% | 44 % | 52% | 57% | 61% | 63% |
| C&D | 64% | 62% | 67% | 73% | 75% | 69% | 76% |
Source: EPA data 2015
Notes: * Waste Avoidance and Resource Recovery Strategy targets first established. C&D = construction and demolition. C&I = commercial and industrial.
Figure 7.2: Waste disposed and recycled by waste stream for NSW, 2002–03 to 2012–13
Source: EPA data 2015
Note: C&D = construction and demolition. C&I = commercial and industrial.
Data for Figure 7.2
Litter trends
The 2014–15 National Litter Index (NLI) Annual Report indicates that the amount of litter in NSW is continuing its downward trend (Figure 7.3). In 2014–15 the amount of litter by item decreased at a much greater rate than the national average. The number of littered items decreased by 16% compared to 2013–14 data; the national decrease was 4%. Since 2005–06 NSW littered items have fallen by 40% to an average of 48 items, representing the first time since 2006–07 that NSW has fallen below the national average, which is 49 items for 2014–15.
The 2014–15 NLI reports that ‘by volume’ litter had an overall decrease of 9% in volume compared to 2013–14 and a 37% decline since 2005–06. Volume figures include estimated volume of illegal dumping (which are larger items) together with litter volumes. When illegal dumping volume estimates are removed there has been an average decrease of 8% in NSW from 2012–14, which is greater than the national average of 6.8%.
The most littered item in NSW and nationally continues to be cigarette butts, which account for around 31% of all littered items, however there was a decrease from 20 cigarette butts per 1000 m2 in 2013–14 to 15 in 2014–15. While cigarette butts contribute significantly to the number of litter items they do not with respect to volume. Beverage containers constitute 45% of the volume of littered items in the NSW litter stream (excluding illegal dumping), with a steady rise from 35% in 2007–08.
Industrial sites still represent the most littered site type in NSW by both item number and volume, with highways, car parks and retail sites representing moderate amounts of litter items and volumes. Beaches, recreational parks and residential areas continue to be the state’s least littered site types by both item numbers and volumes.
Figure 7.3: NSW versus national averages for litter items and volumes 2005–06 to 2014–15
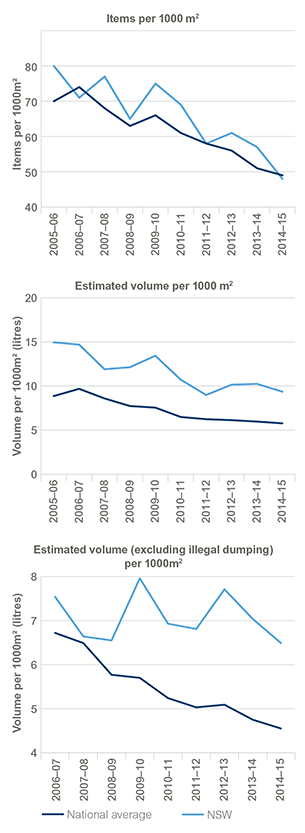
Source: EPA data 2015
Data for Figure 7.3
Pressures
Population growth and increasing economic activity
The link between economic growth, population demographics and the growth in per capita waste production was set out in SoE 2012.
Waste generation is one of the few socioeconomic and environmental indicators that is outpacing economic production. At the national level, per unit of economic production (GVA), waste intensity increased between 1996–97 and 2012–13 when measured for the agriculture, mining and manufacturing industries (ABS 2015). Economic growth in various sectors has historically led to increases in waste generated, for example, uplifts in the housing market or increased infrastructure development is strongly correlated with increases in the amount of C&D waste produced (see Theme 2: Economics and the environment).
Hazardous substances
The availability of infrastructure to collect and treat problem waste streams, including toxic and hazardous wastes, has an impact on the management of these wastes. The difficulties with managing the increasing amount and complexity of these wastes was set out in SoE 2012. A key challenge in this area has been establishing product stewardship programs, in which producers take responsibility for the products they make throughout their lifecycle, including end-of-life. Further, a lack of available community services for the collection and safe disposal of problem wastes has been identified as an issue preventing the community from separating these wastes from existing waste and recycling streams.
Changes in waste materials
There are also broad changes occurring to the composition of waste that may affect recycling rates into the future. These changes include a shift to more complex products and packaging that combine polymers, alloys or material types, which require new technologies in order to separate and recycle the end-of-life product. Increases in plastic packaging of food, for example, may affect the quality and recovery rates of organic waste (Wright et al. 2013).
An emerging pressure for waste policymakers is the presence of plastics in the environment. Of particular concern are the findings from recent scientific research in relation to the impact of microplastics in the marine environment. Microplastics are small plastic particles (less than 5 mm) manufactured in cosmetics and derived from clothing fibres, which enter the water system. Microplastics present environmental risks due to their bioavailability to marine species and their characteristic of adhering to waterborne organic pollutants, resulting in the introduction of toxins to the base of the food chain (Wright et al. 2013).
Human behaviour
Waste avoidance and recovery is strongly influenced by consumer and community behaviour. For example, many households still do not separate their waste correctly and waste which could be recycled is placed in the ‘red lid’ household garbage bin (EPA 2014b). Research has shown that food wastage is caused by consumer behaviours such as poor food storage, lack of meal planning and over-catering thus leading to higher than necessary levels of food waste appearing within the municipal solid waste stream (EPA 2014b). The incidence of littering and illegal dumping is also inherently driven by human behaviour. Attitudes towards littering vary across the types of litters, with some small items such as cigarette butts more likely to be littered. The availability of bins also affects people’s litter behaviour.
Responses
NSW Waste Avoidance and Resource Recovery Strategy 2014–21
Under the Waste Avoidance and Resource Recovery Act 2001, the EPA is required to produce a new NSW waste strategy every five years. The latest waste strategy was adopted in December 2014. It sets a blueprint for the management of waste and resources over the next seven years through ambitious targets to:
- reduce the rate of waste generation per capita
- increase recycling rates across all waste streams
- increase the amount of waste diverted from landfill
- establish drop-off facilities to manage problem household wastes
- reduce the number of litter items to ensure NSW has the lowest litter count
- reduce the incidence of large-scale illegal dumping statewide.
Progress against the waste strategy is to be reported every two years. Each progress report will provide an assessment of performance against the targets. The waste strategy sets the parameters for measuring progress against each of the targets.
Waste Less, Recycle More
Implementation of the waste strategy is underpinned by the $465.7 million Waste Less, Recycle More initiative, a five-year funding package that was introduced in February 2013. In its first two years, this initiative injected $171.5 million into recycling, litter and illegal dumping prevention in NSW, to divert an extra 870,000 tonnes of waste from landfill. The program has stimulated a further $145 million in public and private sector investment in waste and recycling in NSW and helped to create 340 jobs.
To February 2015, Waste Less, Recycle More supported new food and/or garden kerbside waste collections in 31 council areas, 76 new community recycling centres for problem wastes, and free bin trim waste audits for 6569 small to medium businesses. Five regional illegal dumping squads have been established and 77 litter prevention projects are underway. There has been $40 million investment in new recycling infrastructure and support of the well-established Love Food, Hate Waste program through the award of $356,800 in 2012–13.
Local councils have received $79.6 million in direct funding for their own waste and recycling initiatives and worked together through regional waste groups to develop and finalise 13 regional waste strategies.
Illegal Dumping Strategy 2014–16
The waste strategy and Waste Less, Recycle More are supported by a number of implementation strategies to meet NSW waste targets. The Illegal Dumping Strategy 2014–16 (EPA 2014a) is the first of these which was released in June 2014 to deliver an integrated, multifaceted approach to combating illegal dumping. The Illegal Dumping Strategy sets out 21 actions on education, enforcement and infrastructure to prevent people from dumping illegally, and to take strong action against those who persist in doing the wrong thing. As a part of this strategy:
- the incidence of illegal dumping in key metropolitan areas will be reduced
- baseline data to allow target-setting in other parts of the state will be established.
Litter prevention programs
A number of programs have been introduced to achieve the anti-litter objectives of the waste strategy:
- A Draft NSW Litter Strategy has been prepared that will provide key information on why people litter, a broad analysis of NSW’s litter profile, elements for any successful litter program and set out an action table of priority actions for the EPA.
- The Hey Tosser! campaign funded for four years through Waste Less, Recycle More, aims to change the social norms associated with littering. Phase 1 of the campaign ran from April to June 2014 and began to drive the litter prevention message into homes and public spaces across NSW. Research indicates that there has been some shift in social attitudes to littering since the campaign launched, with significant increases in people stating that the issue of littering is very or extremely important (up to 88% from 77%). Phase 2 ran from April to June 2015.
- A Litter Prevention Kit has been published that provides a resource for government, business and the community that includes information on how to run an effective litter prevention project, documenting local litter and Hey Tosser! creative material.
- The Local Litter Check is an easy to use litter diagnostic published by the EPA in 2013. It helps councils and community groups to understand their litter problems, design a solution and measure their results.
- In 2014, $2.67 million was provided to Councils through the EPA’s Litter Prevention Grants. Over $500, 000 has been made available to community groups between 2013 and 2015 to tackle local litter hotspots.
- The EPA introduced a new Report Littering System in February 2015 whereby members of the public could report incidents of litter being dropped from vehicles. In March 2015 as a result of the new system the EPA began to issue fines; prior to the system the EPA issued advisory letters based on public reports. At 30 June 2015, 7111 people registered to report litter, 5027 reports were received and 2605 fines were issued by the EPA for littering from vehicles. This indicates a significant increase on previous enforcement activity and a high involvement by the community.
- The Review of NSW Waste and Environment Levy: Final Report (KPMG 2012) and amendments to the Protection of the Environment Operations (Waste) Regulation 2014 (POEO Waste Regulation) (commencing 1 August 2015).
Reforms to the waste regulatory framework
Creating a stable and level playing field within the waste sector increases investor confidence and ensures legitimate businesses can compete in the market. A number of changes have been made to the waste regulatory framework to modernise the waste industry since SoE 2012, including:
- using GPS tracking devices on vehicles used to transport waste through amendments to the Protection of the Environment Operations Act 1977 (POEO Act), commenced 1 January 2015
- introduction of the proximity principle, which addresses the environmental and human health impacts in NSW associated with the unnecessary transportation of waste over long distances and places responsibility on licensed facilities for the waste they generate (POEO Waste Regulation, commenced 1 November 2014)
- increased enforcement and sentencing options for repeat waste offenders through amendments to the POEO Act, commenced 1 October 2013
- implementing changes to the waste levy as recommended by the independent review of the NSW Waste and Environment Levy and amendments to the POEO Waste Regulation (commencing 1 August 2015).
Future opportunities
The past three years have seen significant developments in the allocation of resources to the waste strategy and waste program. It is likely that in the immediate future, the waste policy space will be impacted by the implementation of these developments, as initiatives aimed at achieving the waste targets have an impact and the success of the Waste Less, Recycle More program becomes more apparent through measured outcomes.
The NSW Government is committed (ME 2015) to implementing a container deposit scheme (CDS) for the recycling of drink containers by 1 July 2017. Objectives of the scheme will include reducing litter and increasing resource recovery.
The intention is for NSW to implement a modern, cost-efficient scheme, which utilises modern technologies, such as reverse vending machines, and which complements the existing kerbside recycling system. This reform is part of the broader action being undertaken by the NSW Government to reduce litter generally, with the objective of delivering the government’s target of a 40% reduction in litter volume by 2020.
Opportunities for government to address emerging issues will continue to arise, including:
- adoption of issue-specific strategies under the umbrella of the waste strategy, such as the draft infrastructure strategy and draft litter prevention strategy
- options for minimising microplastics in the marine environment.
References
ABS 2015, Australian Environmental-Economic Accounts, 2015, cat. no. 4655.0, Australian Bureau of Statistics, Canberra [www.abs.gov.au/ausstats/abs@.nsf/mf/4655.0] Cited in: Ch 7; Ch 2
DECC 2007, NSW Waste Avoidance and Resource Recovery Strategy 2007, Department of Environment and Climate Change NSW, Sydney [www.epa.nsw.gov.au/wastetools/policymakers.htm] Cited in: Ch 7
EPA 2012, New South Wales State of the Environment 2012, NSW Environment Protection Authority, Sydney [www.epa.nsw.gov.au/soe/soe2012] Cited in: Ch 7; Ch 2; Ch 8; Ch 12(1); Ch 12(2); Ch 13(1); Ch 13(2); Ch 14; Ch 16; Ch 17; Ch 19; Ch 20(1); Ch 20(2)
EPA 2014a, NSW Illegal Dumping Strategy 2014–16, NSW Environment Protection Authority, Sydney [www.epa.nsw.gov.au/illegaldumping/nsw-strategy.htm] Cited in: Ch 7
EPA 2014b, NSW Waste Avoidance and Resource Recovery Strategy 2014–21, NSW Environment Protection Authority, Sydney [www.epa.nsw.gov.au/wastestrategy/warr.htm] Cited in: Ch 7(1); Ch 7(2); Ch 7(3); Ch 7(4)
KPMG 2012, Review of NSW Waste and Environment Levy Final Report, report prepared by KPMG on behalf of the NSW Environment Protection Authority, KPMG, Sydney [www.epa.nsw.gov.au/wastetools/policymakers.htm#content] Cited in: Ch 7
ME 2015, ‘Government Announces Container Deposit Scheme Advisory Committee’, media release, Minister for the Environment, 26 June, Sydney [www.epa.nsw.gov.au/epamedia/MinMediaReleases.htm] Cited in: Ch 7
Wright, SL, Thompson, RC & Galloway, TS 2013, ‘The physical impacts of microplastics on marine organisms: A review’, Environmental Pollution, 178, pp. 483–492 [dx.doi.org/10.1016/j.envpol.2013.02.031] Cited in: Ch 7(1); Ch 7(2)