
Water supplies for NSW metropolitan areas and regional cities and major towns are being managed by the water utilities via drinking water management systems established under the requirements of the Public Health Act 2010. These are based on the Australian Drinking Water Guidelines and are overseen by NSW Health. In 2013–14 Sydney Water, Hunter Water and all large regional water utilities had 100% overall compliance with the microbiological and chemical standards of the guidelines.
Statutory water sharing plans covering about 95% of water use in NSW have been developed. These plans provide better security of entitlement for all water users as well as the environment; this process helps meet the NSW Government’s goal of securing long-term potable water supplies for urban communities.
Although water demand has risen with population growth across the state, actions to reduce water consumption continue, with Sydney Water and Hunter Water both maintaining per person water use below licence targets. Median per property consumption for regional water utilities has been relatively stable for the past seven years. Regional local water utilities have reduced average annual residential water use by 48% over the last 23 years (a saving of about 90 GL annually).
Related theme: 3 Energy consumption
NSW indicators
| Indicator and status | Environmental trend |
Information availability |
|
|---|---|---|---|
| Proportion of the metropolitan and regional water supply meeting reliability standards for water quality | |
Stable | ✔ ✔ ✔ |
| Total and per person water consumption for metropolitan and regional centres | |
Increasing impact | ✔ ✔ ✔ |
| Water recycling | |
Decreasing impact | ✔ ✔ ✔ |
Notes: Terms and symbols used above are defined in About SoE 2015 at the front of the report.
Context
The security of water resources depends on an adequate supply of good quality water. Water resources are critical for the supply of town water, stock and domestic water, the irrigation of crops, mining and industry. Meeting these needs will help to enable future economic growth.
Conversely, water resources are needed to preserve the health of riverine, estuarine and wetland ecosystems, and to maintain the food chains that support fish and other aquatic species.
Sustaining human use of water can only be achieved by also maintaining healthy aquatic systems, as degradation and overuse of our waterways will lead to societal costs and economic constraints.
Across NSW agriculture accounts for up to 80% of water use (depending on conditions, e.g. drought). While urban consumption is generally less than 10% on a statewide basis, extraction for urban consumption can have ongoing impacts on river flow in areas of significant population density (see Theme 16: Water resources).
Maintaining high levels of water extraction relative to total river flows over an extended period places stress on river health. Water storages and regulating structures have been built to provide greater security of supply by moderating stream flow variability. In Australia, aquatic ecosystems, particularly inland rivers, are adapted to highly variable flow levels. To a significant extent, aquatic species are dependent on this variability to maintain or complete their life cycles. Over the longer term, modification of natural flow patterns contributes to a loss of biodiversity and declining health in aquatic ecosystems.
Status and trends
Urban drinking water quality
Across the greater metropolitan area (not including the Central Coast) water is supplied by Sydney Water and Hunter Water. Across the Central Coast and the rest of NSW, drinking water is supplied by 95 local water utilities (LWUs), mostly local government councils. (Here, supply relates to areas where the utilities have more than 10,000 connected properties.)
The NSW Government has endorsed the Australian Drinking Water Guidelines (NHMRC & NRMMC 2011) as the benchmark for providing water to the people of NSW. These guidelines include the Framework for Management of Drinking Water Quality which sets out a preventative risk management approach for drinking water quality, considering the whole supply system from the catchment to the household.
Water quality monitoring compliance data collected by the NSW Health Drinking Water Monitoring Program shows that NSW drinking water quality in metropolitan areas and regional cities and towns meets the Australian guidelines.
Over the past three years drinking water quality from both Sydney Water and Hunter Water have met the microbiological and chemical quality criteria of the Australian Drinking Water Guidelines (NOW 2015a, Table 12).
Outside the main metropolitan areas, 2013–14 was the first year in which all 95 LWUs had 100% overall compliance with the guidelines (NOW 2015a, Table 12) – up from around 92–93 of the 95 LWUs in earlier years.
In both 2012–13 and 2013–14, the public drinking water supply for 99.9% of the urban population in regional NSW complied with the guidelines for both microbiological and chemical water quality.
For each of the past three years, about 20,000 water samples are tested for microbiological compliance from across the 95 LWUs operating in NSW. More than 99.7% of the individual samples have complied. Around 4250 samples are tested for physico-chemical compliance annually, with at least 98.5% complying.
Nevertheless, monitoring acts as verification of the risk management framework, and by itself does not protect against contamination; meaning that from time to time there are incidents and alerts which highlight the need to improve preventive risk management.
Sources and volume of water drawn
Tracking the volumes of water from sources, such as reservoirs, in-stream, groundwater aquifers and recycled water schemes, underpins sustainable water management.
Surface water dominates water supply for NSW cities and large towns. In addition, across the western slopes and plains, and in the larger coastal catchments, groundwater is often a significant component of water supplies (Table 6.1). (Here, urban water use relates to areas where the utilities have more than 10,000 connected properties.)
Recycled water is a small, but growing portion of the total water supply, for example, in 2013–14, 84% of non-metropolitan LWUs recycled effluent (NOW 2015a, Table 8).
Year by year, the proportion of each source drawn by the utilities will change, mostly due to weather conditions impacting on surface water availability and reservoir volumes. Over the past three years total water use has varied between 656.5 GL and 827.4 GL. Despite this 26% variation over a three year period, over the longer term (seven years), overall urban water use has an annual average growth rate of 1.35%, with recycled water growing at 0.71% per year.
Sydney (volumetrically the largest supply utility) dominates these trends – both for improvements in water recycling and total demand growth.
Table 6.1: Urban water sources 2013–14, and annualised typical change (7 years)
| Utility | Surface water** | Groundwater | Recycled water*** | |||
|---|---|---|---|---|---|---|
| (more than 10,000 connected properties)* | ML | % | ML | % | ML | % |
| Sydney Water | 530,587 | 0.9% | – | – | 41,543 | ++ |
| Hunter Water | 67,520 | 0.9% | 4,230 | –5.6% | 2,505 | – |
| Albury | 7,599 | 4.8% | – | – | – | – |
| Ballina | 3,840 | 1.2% | – | – | 257 | – |
| Bathurst Regional | 6,354 | –1.7% | 9 | – | 638 | – |
| Bega Valley | 1,756 | 6.0% | 1,489 | –3.4% | 623 | – |
| Byron | 2,837 | 1.1% | – | – | 390 | – |
| Clarence Valley | 6,199 | –3.5% | – | – | 176 | – |
| Coffs Harbour | 5,957 | 1.7% | – | – | – | – |
| Dubbo | 6,406 | 0.3% | 1,934 | 0.8% | – | – |
| Essential Energy | 5,700 | 1.8% | – | – | 515 | – |
| Eurobodalla | 3,055 | –5.2% | 363 | – | 216 |
– |
| Gosford | 16,110 | 5.1% | 123 | –3.2% | 32 | – |
| Goulburn Mulwaree | 2,759 | 3.0% | – | – | – | – |
| Kempsey | – | – | 3,627 | 12.0% | 97 | – |
| Lismore | 3,426 | –0.7% | – | – | – | – |
| MidCoast | 8,124 | –1.3% | 542 | –3.5% | 372 | – |
| Orange | 4,557 | 0.4% | 59 | 9.7% | 2,903 | – |
| Port Macquarie–Hastings | 6,090 | –0.9% | – | – | 142 | ++ |
| Queanbeyan | 3,995 | 2.0% | – | – | – | – |
| Riverina | 2,681 | –9.3% | 11,819 | 1.3% | – | – |
| Shoalhaven | 14,049 | –0.9% | – | – | 194 | – |
| Tamworth Regional | 9,358 | 5.1% | 579 | –7.2% | – | – |
| Tweed | 9,808 | –0.4% | – | – | 563 | – |
| Wingecarribee | 5,671 | –0.2% | – | – | 124 | ++ |
| Wyong | 15,914 | –1.6% | 6 | –14.0% | 962 | – |
| Total (LWUs) | 152,245 | –0.1% | 20,550 | –1.5% | 8,204 | – |
| Total | 750,352 | 0.7% | 24,780 | –1.8% | 52,252 | ++ |
| Overall total 827,384 ML in 2013–14, 1.35% annual average increase | ||||||
Source: DWE 2009a, Table 8; NOW 2010, Table 8; NOW 2011, Table 8; NOW 2012, Table 8; NOW 2013, Table 8; NOW 2014, Table 8; NOW 2015a, Table 8.
Notes: Does not include irrigation and other non-urban supply.
As local water utilities (LWUs) may draw on different sources depending on conditions (e.g. drought) the breakdown between sources can vary significantly year by year. The annualised typical change is the 7-year linear trend for each water source (LWUs with fewer than 5 years of data have been excluded).
* Data on the smaller LWUs can be found in the sources.
** Surface water includes bulk water purchased from non-retail suppliers such as WaterNSW (previously the Sydney Catchment Authority).
*** ‘++’ typical annual average over 7 years exceeds 20%; ‘–‘ annual average change unclear or less than ±20%.
Pressures
Water pollution
The quality of water affects its suitability for human use and may affect the health of aquatic ecosystems. To a significant extent, water quality reflects the state of vegetation cover and land management practices in river catchments, and the land overlying aquifer recharge zones.
Water demand
Water efficiency efforts have seen per property water consumption reduce (see Responses, below), however there is constant pressure on water supplies from the demands of a growing population.
Sydney
Before 2004–05, the proportion of potable water consumed across Sydney Water’s areas of operation – Sydney, the Illawarra, Blue Mountains and adjacent areas – compared to the long-term sustainable yield, had grown to exceed 100%. At its peak, 650 GL per year of potable water was being supplied to users, including residential, industrial, commercial and government. This proportion fell to 89% in 2013–14.
This translates to a daily potable water consumption pattern that has been steadily declining, down from 343 litres per person in 2004–05 to 307 litres in 2013–14 (Figure 6.1) (Sydney Water 2014). This figure is well below the water conservation target in Sydney Water’s operating licence of 329 litres per person per day by 30 June 2011, and which was achieved five years early.
Despite a population increase across Sydney Water’s area of operations of about 27% over the past two decades, total water use has declined by about 15%. This sustained decline is primarily due to changes in water use behaviour (influenced by voluntary and mandatory water restrictions) together with various demand management programs, such as water efficiency, leakage reduction programs and water recycling.
Figure 6.1: Demand for potable water, Sydney Water (1996 to 2014) and Hunter Water (2002–03 to 2013–14)
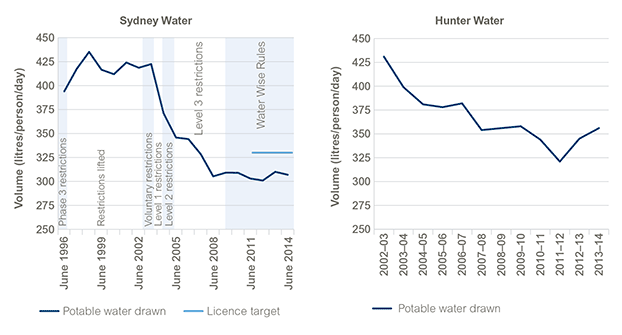
Source: NWC 2009; Hunter Water 2011; NWC 2011; Sydney Water data 2015; Hunter Water 2014
Notes: This figure shows total residential and non-residential consumption relative to total population across the utilities’ operational areas.
Data for Figure 6.1
Lower Hunter
Over the past 12 years, Hunter Water has supplied between 63.2 and 77.6 GL of potable water per year across its area of operations, comprising the local government areas of Newcastle, Lake Macquarie, Maitland, Cessnock, Port Stephens, and (since 2008) Dungog.
As a result of a wet year and mild conditions experienced over the 2011–12 summer period, residential water use (both per person and per property) was at a 10-year low in 2011–12. The summers of 2012–13 and 2013–14 returned to typical hot dry weather, resulting in higher water use (Hunter Water 2014).
Over the past 12 years, daily potable water consumption has declined by about 12%, despite a population growth of over 10%. This means that annual per person potable water consumption has fallen by as much as 25% (in 2011–12) and has averaged 20% over the past five years (Figure 6.1).
Residential water use
In Sydney, the Illawarra and Lower Hunter, the residential sector is the largest water user, accounting for around 65 to 75% of total water consumed.
In regional NSW, the residential sector accounts for two-thirds of total urban water consumed (NOW 2012, Table 8). In regional NSW, over the past 23 years, the average annual volume of water supplied by LWUs to connected residential properties has fallen by 48% (a saving of about 90 GL per annum). From an annual median of 330 kilolitres per connected property in 1991–92, demand dropped to 173 kL in 2013–14. For five of the past seven years, the annual demand has been 172 kL, with a small decrease to 159 kL and 155 kL per connected property in 2010–11 and 2011–12 respectively (Figure 6.2).
Figure 6.2: Average annual per-property residential water consumption by local water utilities, 2004–05 to 2013–14
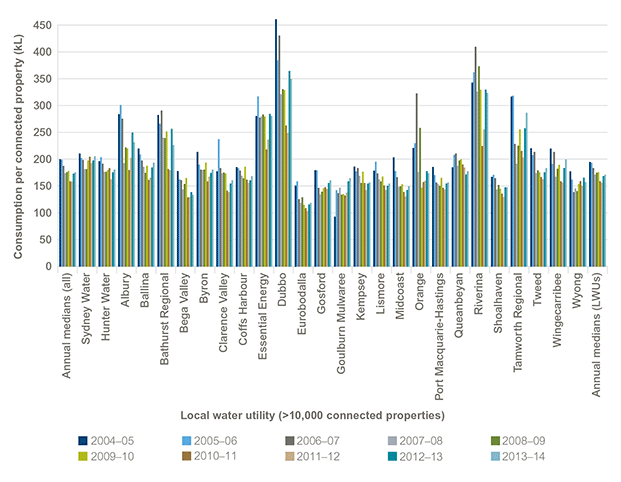
Source: DWE 2009a, Table 10; DWE 2009b, Table 10; NOW 2010, Table 10; NOW 2011, Table 10; NOW 2012, Table 10; NOW 2013, Table 10; NOW 2014, Table 10; NOW 2015a, Table 10
Notes: This figure shows total residential consumption relative to total residential connections across the utilities’ operational areas.
Local water utilities (LWUs) included have more than 10,000 connected properties. Data for the smaller LWUs are available in the source tables.
The Hunter Water supply network interconnects with adjacent LWUs, enabling it to supply and receive bulk treated water from Wyong and Gosford councils and MidCoast Water.
Note that the statewide median for regional NSW was 196, 188 and 166 litres per person /day in 2013–14, 2012–13 and 2011–12 respectively.
Data for Figure 6.2
Drought and climate change impacts on water demand
As droughts occur naturally in Australia, aquatic ecosystems adapt to periods of dryness. However, severe, extensive or prolonged drought can have major repercussions –for the environment and water users, as well as socioeconomically.
The condition of riverine water quality, along with the effects of catchment disturbance, diffuse runoff from agricultural activities and urban expansion, are discussed in Theme 16: Water resources. The condition of groundwater is discussed in Theme 19: Groundwater.
Over the longer term, projected changes in rainfall due to climate change are expected to create risks for water availability (Vaze & Teng 2011). In addition, the frequency and intensity of heavy rainfall events leading to flooding are likely to be different from the impacts on seasonal or average rainfalls (DECCW 2010).
Moreover, the volume of water held in storages varies with climatic conditions, partly because of changes to rainfall, evapo-transpiration and runoff and also because hotter, drier conditions increase the watering of lands and use of evaporative coolers.
Responses
To help secure long-term potable water supplies for towns and cities statutory water sharing plans have been developed under the Water Management Act 2000. These plans provide better security of entitlement for all water users as well as the environment. About 95% of water use in NSW is now covered by a water sharing plan (for details, see Theme 16: Water resources).
Planning for water use to meet current and future socioeconomic demands and environmental needs must be balanced. It should also take into account the long-term variability in water availability due to the extremes of climate, such as droughts and floods. As such, there are three distinct components to water management in NSW:
- metropolitan water use (Sydney, the Illawarra, the Blue Mountains and adjacent areas; and the lower Hunter)
- urban water use in regional areas (the upper Hunter, Central Coast and country towns)
- rural water use (see Theme 16: Water resources).
Management plans
Metropolitan water management
Metropolitan water plan: The 2010 Metropolitan Water Plan (NSW Government 2010) sets out how the NSW Government will provide a secure and sustainable supply of water to meet the needs of Sydney, the Blue Mountains and the Illawarra. The plan is currently being reviewed to take account of the latest data, research findings and technological advances.
There are four major parts of this plan to secure ‘Water for Life’:
- Dams – A network of dams supplies the majority of Sydney’s drinking water. Continued investment in the network will help to ensure this key element of supply. The Water Wise Rules (see end of this section) help keep more water in dams during droughts, and the existing dams have been modified to allow for greater draw-down at such times of drought, and new infrastructure can allow storages to be replenished from groundwater reserves.
- Recycling – Recycled water schemes have been developed with the capacity to deliver 63 GL of recycled water in greater Sydney (see also Status and trends).
- Desalination – In case of severe drought Sydney’s desalination plant can produce up to 90 billion litres of water a year, enough to supply up to 15% of greater Sydney’s current water needs.
- Water efficiency – Improvements in water efficiency can be achieved by installing more efficient appliances, educating the community and modifying processes to help use water wisely (see also Demand management initiatives below).
Water conservation measures adopted during times of drought over the last decade have been replaced by a simpler set of common-sense, Water Wise Rules for Sydney, the Blue Mountains and the Illawarra (Figure 6.1). These permanent rules are designed to embed good practice amongst all water users; and water consumption remains well below levels seen prior to the previous drought. However, maintaining and improving the full range of savings previously achieved has yet to be accomplished.
Lower Hunter Region: The NSW Government’s Metropolitan Water Directorate led the development of the Lower Hunter Water Plan (DFS 2014) in close consultation with Hunter Water, other government agencies and the Lower Hunter community. Released in April 2014, the plan is a package of water supply and demand measures that ensures a reliable water supply over the long term and sets out actions for responding to severe droughts. A key recommendation of the Lower Hunter Water Plan was the implementation of the Water Wise Rules (see ‘Metropolitan water plan’) which commenced on 1 July 2014.
The plan also sets out actions for responding to droughts, including:
- additional water efficiency initiatives for households and business
- increased water recycling where viable
- water restrictions
- water transfers to and from the Central Coast under an existing transfer agreement
- temporary, portable desalination units, as a contingency measure for responding to a very extreme drought.
The shift towards higher density living over the longer term, the use of water efficient appliances, the implementation of the Water Wise Rules, and NSW BASIX requirements are likely to be strong influencing factors that will help the Hunter region continue improving (downward) the average water consumption of its customers.
Urban water management
Country Towns Water Supply and Sewerage Program: More than one million people in NSW live in country towns. This key program assists regional LWUs to provide appropriate, affordable, cost-effective, and sustainable urban water supply and sewerage services. Along with the NSW Best-Practice Management of Water Supply and Sewerage Framework (NOW 2015b), the program mandates:
- strategic business planning
- sound pricing to achieve full cost recovery and encourage efficient use of the services
- use of the NSW performance monitoring and benchmarking system (operated by DPI Water)
- integrated water cycle management to assist LWUs achieve sustainable, affordable and cost-effective water supply, sewerage and stormwater services.
Financial grants help with infrastructure improvements needed to deliver improved public health, environmental outcomes, and security of supply. Over the program’s life (from 1994–95 to 2016–17), over $1.2 billion is projected to have been invested via the program.
Drinking water quality management: NSW Health has oversight of drinking water quality in regional NSW. It administers the requirement (under the Public Health Act 2010 and Public Health Regulation 2012) that all water suppliers must establish and adhere to a Drinking Water Management System.
NSW Health and DPI Water have jointly developed the NSW Guidelines for Drinking Water Management Systems. Local Public Health Units and DPI Water officers meet with utilities to discuss progress on implementation, review and audit of management systems. This also involves identifying barriers to implementation and solutions (such as minor works, treatment optimization and improved monitoring).
These management systems provide water suppliers with a structured risk-based approach to managing drinking water quality. The process of developing management systems and improvement plans has highlighted the need to identify and reduce potential risks in catchments, treatment plants and distribution systems.
To date NSW Health has assisted 74 regional water utilities to develop their management systems. Other utilities have developed their management systems independently.
NSW Health also records water quality monitoring compliance data, which is incorporated into the NSW performance monitoring and benchmarking system.
Pricing water better
Giving customers strong water pricing signals can reduce water consumption by more accurately reflecting the value of water resources and the true costs of supplying water. In NSW water prices are set or overseen by the NSW Independent Pricing and Regulatory Tribunal (IPART). Water pricing has undergone significant reform over the past 20 years, with tariffs shifting away from a reliance on fixed annual charges towards ‘pay-for-use’ pricing.
All water utilities in NSW now have domestic water metering. All free water allowances for potable water supply ceased by 2007. Up to 2011–12, the gradual increase in the median residential water usage charge for LWU customers was reflected in an ongoing reduction in average demand per connected property, producing a relatively stable typical water supply residential bill (i.e. steady in CPI-adjusted terms).
Over the past three years, increases in the median charge and the average demand per connected property has led to a statewide median typical residential bill for water supply of $582 (Jan 2015$). This represents only a 1% annual average increase over nearly two decades (NOW 2015a).
In addition to helping achieve a steady reduction in the residential water supplied per property, strong pricing signals over the last decade have also enabled regional NSW LWUs to avoid over $1 billion in capital expenditure for augmenting headworks and treatment capacity.
Rainwater tanks
Across NSW the use of rainwater tanks as an adjunct to reticulated supply is increasing. For example, on the Central Coast (Gosford and Wyong) there are over 18,500 tanks installed, representing 1-in-7 connected properties (NOW 2015a, Appendix J).
Demand management initiatives
In 2013–14 51.8 billion litres of water were recovered from recycled water schemes operated by Sydney Water, local councils and private schemes.
Metropolitan
Water efficiency and recycling assist in reducing the demands on drinking water supplies across Sydney Water’s areas of operation (Sydney Water 2014):
- Twenty-three recycled water schemes recycled 47 billion litres in 2013–14, saving 13 billion litres of drinking water. These schemes can also reduce nutrient discharge and free up water that can be released from the supply dams for environmental flows. Together, these help improve downstream river health.
- Water efficiency measures and residential and business demand management programs (such as WaterFix and the Every Drop Counts Business Program) saved over 45 billion litres of drinking water in 2013–14.
Sydney Water actively looks for and repairs leaks. In 1999–2000, leaks wasted over 180 ML of water a day. In 2013–14, leakage was estimated to account for 107 ML per day (39 GL per year), about 7.4% of potable water used. Since 2008, Sydney Water has been within its target band for water leakage (105±16 ML per day) (Sydney Water 2014).
Water Savings Action Plan requirements were established in 2005 under the Energy and Utilities Administration Act 1987.
In Sydney Water’s area of operations, action plans were required of all local councils, businesses and government agencies that use more than 50 ML of water per year per site. The plans involved assessing current water use and identifying cost-effective measures to reduce water consumption. Full implementation will save an estimated 8272 ML of water each year.
Regional
Across the many LWUs in regional NSW there are a wide range of demand management and water conservation measures being implemented. These are reported via the NSW performance monitoring and benchmarking system (e.g. see NOW 2015a, Table 8C).
NSW Government responses
The Building Sustainability Index
The Building Sustainability Index for new homes was introduced in 2004 to ensure homes are designed to use up to 40% less urban water than the average dwelling built before its introduction. Based on the commitments made on BASIX certificates, the average BASIX-compliant home has water consumption of around 135 litres per person per day. These savings reduce statewide demand by 13 GL per year. By the end of the 2013–14 financial year, cumulative water savings amounted to more than 103 GL of potable water. Water efficiencies from BASIX-compliant alterations and additions will add further savings.
The NSW Climate Change Fund
Established in 2007, the Climate Change Fund supports a range of programs helping business, households, schools, communities and government to save water and energy. These programs include the Water Savings Fund, Central Coast Water Savings Fund, Rainwater Tanks in Schools, NSW Green Business and Public Facilities.
At 30 June 2014, supported projects are estimated to be saving more than 14 GL of water per year (OEH 2014) (see also Theme 3: Energy consumption):
- households – 5.6 GL/y
- businesses – 5.6 GL/y
- government – 1.7 GL/y
- community – 1.3 GL/y.
On average, every dollar the fund has invested in energy and water saving initiatives delivers more than $4.20 in utility bill savings.
Sustainability advantage
The Sustainability Advantage program works to improve organisations’ competitiveness and financial performance by targeting the delivery of better environmental practices by the business. It focuses on industrial ecology projects among businesses keen to exploit opportunities for the exchange of materials, energy, water and by-products.
National responses
Initially a NSW program, the National Australian Built Environment Rating System (NABERS) developed into a national program that rates buildings on the basis of their measured environmental impacts. Management effectiveness measures have been developed for issues such as energy, water, stormwater runoff and pollution, sewage, landscape diversity, waste and toxic materials. These measures provide an indication of how well the issues are being managed.
NABERS Water ratings are available for commercial office buildings, hotels, shopping centres and homes. OEH is working with the NSW Department of Education and Communities to develop a rating for NSW schools and with NSW Health to rate public hospitals.
In 2010–11, 431 NABERS Water ratings were issued. Close to 600 businesses are engaging with NABERS to rate their premises. NABERS has driven substantial efficiency gains in the built environment. On average, office buildings using NABERS to measure and manage their water use have improved their water efficiency by 9%. Altogether, these buildings are saving 1100 ML of water each year.
Under the national Water Efficiency Labelling and Standards (WELS) scheme, registration and water efficiency labelling of washing machines, dishwashers, toilets, urinals, taps and showers is mandatory. The introduction of water efficiency labelling of combined clothes washer–dryers is also currently being considered (DEWHA 2008). At present, only toilets are subject to minimum water efficiency standards. Through its participation in the WELS scheme, the NSW Government proposes introducing minimum standards for washing machines and dishwashers.
The National Water Initiative (NWI) is a shared commitment by governments across Australia to increase the efficiency of water use and provide greater certainty for investment and productivity for communities and the environment. The urban water component of the NWI focuses on the need to secure urban water resources by improving the reliability of supply, water efficiency and integrated water planning. The NSW Implementation Plan for the National Water Initiative (NSW Government 2006) contains specific actions for implementing the NWI’s eight key elements. All 32 eligible NSW urban water utilities have met the rigorous national auditing requirements. Information is published annually by the Australian Government through the National performance reports (e.g. National Performance Report 2013–14: Urban water utilities (BOM 2015)).
References
BOM 2015, National Performance Report 2013-14: Urban water utilities, Bureau of Meteorology, Canberra [www.bom.gov.au/water/npr] Cited in: Ch 6
DECCW 2010, NSW Climate Impact Profile, Department of Environment, Climate Change and Water NSW, Sydney [www.climatechange.environment.nsw.gov.au/Impacts-of-climate-change/2010-NSW-climate-impact-reporting] Cited in: Ch 6; Ch 11; Ch 20(1); Ch 20(2); Ch 20(3)
DEWHA 2008, Regulation Impact Statement (For Consultation): Minimum water efficiency standards for clothes washers and dishwashers and water efficiency labelling of combined washer/dryers, prepared by George Wilkenfeld and Associates for the Department of the Environment, Water, Heritage and the Arts, Canberra [www.waterrating.gov.au/resource/consultation-whitegoods-regulation-impact-statement] Cited in: Ch 6
DFS 2014, 2014 Lower Hunter Water Plan, Metropolitan Water Directorate, NSW Department of Finance and Services, Sydney [www.metrowater.nsw.gov.au/planning-lower-hunter/2014-lower-hunter-water-plan] Cited in: Ch 6
DWE 2009a, 2007–08 NSW Water Supply and Sewerage Benchmarking Report, Department of Water and Energy, Sydney [www.water.nsw.gov.au/urban-water/country-town-water/best-practice-management/performance-monitoring#bench] Cited in: Ch 6(1); Ch 6(2)
DWE 2009b, 2006–07 NSW Water Supply and Sewerage Benchmarking Report, Department of Water and Energy, Sydney [www.water.nsw.gov.au/urban-water/country-town-water/best-practice-management/performance-monitoring#P22_1895] Cited in: Ch 6
Hunter Water 2011, Environmental Performance Indicators Report: Annual operating licence report 2010–11, Hunter Water Corporation, Newcastle West Cited in: Ch 6
Hunter Water 2014, Compliance and Performance Report 2013–14, Hunter Water Corporation, Newcastle [www.hunterwater.com.au/About-Us/Our-Organisation/Governance/Regulatory-Reporting.aspx] Cited in: Ch 6(1); Ch 6(2)
NHMRC & NRMMC 2011, Australian Drinking Water Guidelines (2011), National Health and Medical Research Council & Natural Resource Management Ministerial Council, Canberra [www.nhmrc.gov.au/guidelines-publications/eh52] Cited in: Ch 6
NOW 2010, 2008–09 NSW Water Supply and Sewerage Benchmarking Report, NSW Office of Water, Sydney [www.water.nsw.gov.au/urban-water/country-town-water/best-practice-management/performance-monitoring#bench] Cited in: Ch 6(1); Ch 6(2)
NOW 2011, 2009–10 NSW Water Supply and Sewerage Benchmarking Report, NSW Office of Water, Sydney [www.water.nsw.gov.au/urban-water/country-town-water/best-practice-management/performance-monitoring#bench] Cited in: Ch 6(1); Ch 6(2)
NOW 2012, 2010–11 NSW Water Supply and Sewerage Benchmarking Report, NSW Office of Water, Sydney [ www.water.nsw.gov.au/urban-water/country-town-water/best-practice-management/performance-monitoring#bench] Cited in: Ch 6(1); Ch 6(2)
NOW 2013, 2011–12 NSW Water Supply and Sewerage Benchmarking Report, NSW Office of Water, Sydney [www.water.nsw.gov.au/urban-water/country-town-water/best-practice-management/performance-monitoring#bench] Cited in: Ch 6(1); Ch 6(2)
NOW 2014, 2012–13 NSW Water Supply and Sewerage Benchmarking Report, NSW Office of Water, Sydney [www.water.nsw.gov.au/urban-water/country-town-water/best-practice-management/performance-monitoring#bench] Cited in: Ch 6(1); Ch 6(2)
NOW 2015a, 2013–14 NSW Water Supply and Sewerage Benchmarking Report, NSW Office of Water, Sydney [www.water.nsw.gov.au/urban-water/country-town-water/best-practice-management/performance-monitoring#bench] Cited in: Ch 6(1); Ch 6(2); Ch 6(3); Ch 6(4); Ch 6(5); Ch 6(6); Ch 6(7); Ch 6(8)
NOW 2015b, NSW Best-Practice Management of Water Supply and Sewerage Framework, NSW Office of Water, Sydney [www.water.nsw.gov.au/urban-water/country-town-water/best-practice-management] Cited in: Ch 6
NSW Government 2006, NSW Implementation Plan for the National Water Initiative, NSW Government, Sydney [www.water.nsw.gov.au/water-management/law-and-policy/key-policies#policy] Cited in: Ch 6
NSW Government 2010, 2010 Metropolitan Water Plan, NSW Office of Water, Sydney [www.metrowater.nsw.gov.au/planning-sydney/2010-metropolitan-water-plan] Cited in: Ch 6
NWC 2009, National Performance Report 2007–08: Urban water utilities, National Water Commission, Canberra [archive.nwc.gov.au/library/topic/npr/npr-2007-08-urban] Cited in: Ch 6
NWC 2011, National Performance Report 2009–10: Urban water utilities, National Water Commission, Canberra [archive.nwc.gov.au/library/topic/npr/npr-2009-10-urban] Cited in: Ch 6
OEH 2014, NSW Climate Change Fund – Annual Report 2013–14, Office of Environment and Heritage, Sydney [www.environment.nsw.gov.au/grants/ccfund.htm] Cited in: Ch 6
Sydney Water 2014, Water Efficiency Report 2013–14, Sydney Water Corporation, Sydney [www.sydneywater.com.au/web/groups/publicwebcontent/documents/document/zgrf/mdq3/~edisp/dd_047419.pdf] Cited in: Ch 6(1); Ch 6(2); Ch 6(3)
Vaze, J & Teng, J 2011, ‘Future climate and runoff projections across New South Wales, Australia – results and practical applications’, Hydrological Process, 25(1), pp. 18–35 [dx.doi.org/10.1002/hyp.7812] Cited in: Ch 6; Ch 16(1); Ch 16(2); Ch 16(3)