
In 2012–13, over four and a half million Sydney residents made a total of 16.7 million trips by all modes of transport each weekday and 14.6 million trips each weekend day.
Public transport trips increased at a faster rate than population growth in the decade to 2012–13. However, the car is still the dominant mode of transport, accounting for 69% of all trips by Sydney residents.
The transport sector is the main source of NOx emissions in the Greater Sydney region and in 2012–13 was responsible for 19% of NSW greenhouse gas emissions.
The NSW Long Term Transport Master Plan 2012 establishes a framework to guide the development of transport decisions over the next 20 years, including initiatives to manage and minimise the environmental impacts of our transport systems.
Related themes: 1 Population | 5 Greenhouse gas emissions | 8 Air quality
NSW indicators
| Indicator and status | Environmental trend |
Information availability |
|
|---|---|---|---|
| Vehicle kilometres travelled (total) | Increasing impact | ✔ ✔ ✔ | |
| Vehicle kilometres travelled (per person) | Stable | ✔ ✔ ✔ | |
| Public transport use overall trips |
Decreasing impact |
✔ ✔ ✔ | |
Notes: Terms and symbols used above are defined in About SoE 2015 at the front of the report.
Context
Transport plays a key role in allowing people and goods to get from one place to another. There are a variety of reasons why people travel, including commuting to and from work, socialising, recreation, education, childcare, shopping, personal reasons and work-related business.
While transport is critical to move people and goods between locations, it also has impacts for the environment. Transport typically uses non-renewable resources, produces greenhouse gas emissions and generates noise and air pollution.
Reducing congestion, improving accessibility between homes and work and service centres (especially by making public transport a more attractive option) is relevant to all metropolitan and regional centres. Definitive information is available for the Newcastle, Sydney and Wollongong metropolitan areas.
Status and trends
In-depth transport data has been collected for the Sydney Greater Capital City Statistical Area (GCCSA) under the annual Household Travel Survey conducted by the Bureau of Transport Statistics (BTS). The most recent information for 2012–13 is presented below.
Total trips
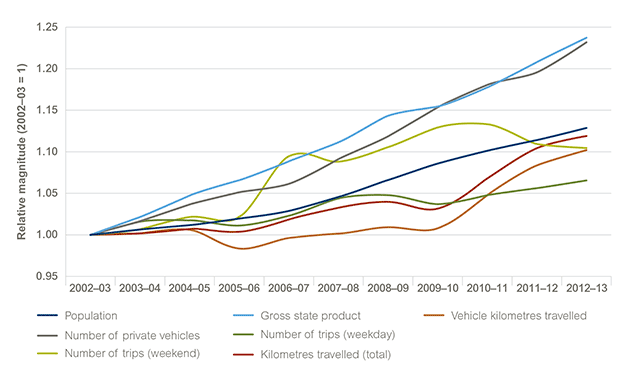
Sydney residents took 16.7 million trips across all modes on an average weekday in 2012–13. This reflects a 10% increase over 2002–03 figures (Figure 4.1). Weekday trips have gradually increased since 2002–03, however there was a slight decline between 2008–09 and 2009–10 from 16.4 million to 16.2 million. Weekend trips of Sydney residents have grown 10% over the last decade, more recently though there has been a decline from the peak of 14.9 million in 2010–11 to 14.6 million in 2012–13 (BTS 2014).
The total number of trips for both weekdays and weekends has increased and this could be correlated directly to population growth. The impacts of transport use on the environment are greater greenhouse gas emissions and increased noise and air pollution (see Theme 8: Air quality and Theme 5: Greenhouse gas emissions).
Figure 4.1: Travel trends 2002–03 to 2012–13 in the Sydney Greater Capital City Statistical Area*
Source: BTS 2014
Notes: * Sydney Greater Capital City Statistical Area extends to and includes the Central Coast (north), Helensburgh (south) and Blue Mountains (west).
Data for Figure 4.1
Trips per person
Daily trips per person portray a different story. Weekday trips have experienced a continual steady decrease of 5.7% from 2002–03 to 2012–13. Over the same time period weekend trips have reduced by 2.1%. The reduction in trips was also reflected in personal business trips and work-related business trips, which decreased 23% and 14% respectively (BTS 2014).
Technology and the effect on the number of trips
This continued decline of per person trips coincides with the rise in smart phone and information technologies, which may have led to the reduction in these travel requirements as online shopping and working from home become more popular (BTS 2014).
Shopping trips grew by 7% over the decade, which is slower than population growth (13%). The Australian Bureau of Statistics (ABS) estimated that 75% of internet users in NSW engaged in online shopping (BTS 2014).
Technological trends could be further supported as a contributor to the reduction in trips by the number of employees working from home rising from 89,000 in 2002–03 to 221,000 in 2012–13, a 148% increase (BTS 2014).
Vehicle ownership
Vehicle ownership in Sydney has steadily risen by 23.2% from 2002–03 to 2012–13, which is at a similar rate to gross state product (24%), and at almost double the rate of population growth (13%). Over the same time period, bicycle ownership has increased by 30.9% (BTS 2014).
The number of vehicles per household increased from 1.4 in 2002–03 to 1.6 in 2012–13, though this is not reflective of the VKT per person, which in the same decade, dropped by 2.1%. This would indicate that, while people own more vehicles, they don’t necessarily drive more. Vehicle ownership and vehicle travel are influenced by a variety of factors including income, fuel prices and environmental consciousness (BTS 2014).
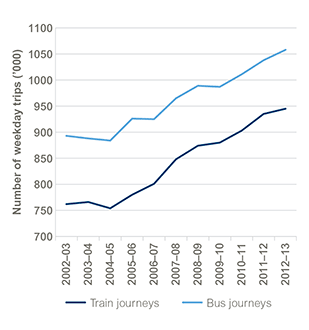
Figure 4.2: Number of train and bus trips on an average weekday for the Sydney Greater City Capital Statistical Area, 2002–03 to 2012–13
Source: BTS 2014
Notes: Based on unlinked trips
Data for Figure 4.2
Public transport
Train trips increased by 24% between 2002–03 and 2012–13, while bus trips increased by 18% (Figure 4.2); the rise in public transport trips far exceeded the number of car trips, which was 5%. The proportion of trips made by train on an average weekday in 2012–13 was 5.4%, and 6% by bus (BTS 2014).
While public transport has numerous social, economic and environmental benefits, travel by car remains the dominant mode choice for Sydney residents, accounting for 69% of trips (BTS 2014). This has environmental implications such as the production of greenhouse gases along with the pressure on non-renewable resources due to the demand for fuel.
Extra vehicles on the roads may lead to increased congestion and ultimately result in more air and noise pollution. Runoff from roads affects water quality, while the construction of roads in bushland may have an impact on biodiversity where it fragments natural ecosystems.
In NSW transport is the fastest growing component of greenhouse gas emissions. In 2013 transport accounted for 19% of greenhouse gas emissions; it is the second largest contributor in the state with stationary energy being the main contributor (see Theme 5: Greenhouse gas emissions). In the Greater Sydney region, transport emissions continue to be the main source of NOx and VOC emissions (see Theme 8: Air quality).
Walking as a mode of travel on an average weekday has risen by 11% from 2002–03 to 2012–13 and while this is encouraging, it is slower than population growth (13%). Younger age groups (below 40 years) are walking more and using public transport, while over 60 age groups rely more on travel by car (BTS 2014).
During 2012–13, 48% of Sydney commuters reported that they used public transport to avoid parking problems. For approximately a third of public transport commuters, speed and cost were also important reasons for their mode choice. Just under a fifth said they used it due to the proximity to their home and workplace. In 2012–13 only 5% of public transport commuters gave environmental factors as a reason for using public transport.
Amount of time travelling
The amount of time spent travelling per person, on an average weekday has remained relatively constant over the 2002–03 to 2012–13 period, ranging from 79 minutes to 81 minutes for a Sydney resident. The average trip duration has risen from 21 minutes to 22 minutes over the same time frame, and has been consistently at 22 minutes since 2010–11 (BTS 2014).
Pressures
The NSW population is expected to grow to around nine million by 2031. Continued growth brings with it an increase in passengers for trains, light rail, buses, ferries, more traffic on the roads and more goods moving around the state. Where the growth in traffic leads to increasing congestion, the pressures on the environment are also exacerbated, whereas if traffic is able to flow smoothly the environmental impact is lessened.
There are also many factors which can ease the pressure that transport generates on the environment:
- the frequency, reliability and quality of public transport and the areas it serves
- the availability and quality of pedestrian and cycling facilities
- advances in transport technologies, particularly increases in fuel efficiency, low emission vehicles and the use of cleaner fuels
- reducing the distance people need to travel to their places of work or essential facilities.
Fluctuations in the price of fuel can lead to the car being seen as a more or less favourable alternative to public transport.
Responses
Strategic direction
The NSW Government released the NSW Long Term Transport Master Plan (NSW Government 2012) in December 2012, which establishes the overarching framework to guide the development of transport planning, policy, reform and funding decisions to support sustainable growth for metropolitan and regional NSW over the next 20 years.
In June 2014 the Government announced Rebuilding NSW. This plan will invest $20 billion in new productive infrastructure, including a second harbour rail crossing and a third harbour road crossing. To support Sydney’s anticipated population growth, $8.9 billion is also reserved for urban public transport.
A series of regional, corridor and mode specific plans were progressively released over 2012 and 2013. These plans set out the initiatives that will improve the performance of the transport network, in a way that integrates transport and land use while minimising the impacts on the environment.
Mode specific plans include:
- Sydney’s Rail Future (TfNSW 2012b) – a long-term plan to increase the capacity of Sydney’s heavy rail network through investment in new services and upgrading existing infrastructure
- Sydney’s Light Rail Future (TfNSW 2012a) – a plan to reduce congestion and revitalise Sydney
- Sydney’s Bus Future (TfNSW 2013a) – a 20-year plan to redesign the city’s network of over 600 bus routes to sustainably meet customer needs
- Sydney’s Ferry Future (TfNSW 2013c) – outlines short and long-term initiatives for the ferry network
- Sydney’s Cycling Future (TfNSW 2013b) – coordinates planning and investment in infrastructure and projects thus resulting in a safer and connected network of bicycle paths.
- Sydney’s Walking Future (TfNSW 2013d) – sets out actions to make walking the transport choice for quick trips under two kilometres and will help people access public transport.
These transport plans deliver the critical transport infrastructure components of the State Infrastructure Strategy 2012–32 (Infrastructure NSW 2012), which was updated in 2014 (Infrastructure NSW 2014), and support land-use planning for Sydney’s future population and employment outlined in the Government’s Plan for Growing Sydney (NSW Government 2014).
Major projects
Six major projects have been completed or are underway to help improve public transport and reduce congestion.
Inner West Light Rail Extension was completed in 2014. It includes a 5.6 kilometre extension of the light rail from Lilyfield to Dulwich Hill, nine new light rail stops: Leichhardt North, Hawthorne Marion, Taverners Hill, Lewisham West, Waratah Mills, Arlington, Dulwich Grove and Dulwich Hill, and 12 new light rail vehicles. It improves access to public transport and connections between where people live, work and visit.
South West Rail Link was completed in 2014. It includes the major upgrade of Glenfield Station and bus/rail interchange and a new twin track passenger rail line from Glenfield to Leppington. Benefits include increased and more reliable train services and increased commuter car parking services, thus improving access to public transport for the people of South West Sydney.
Sydney Metro Northwest, which will be the first fully-automated metro rail system in Australia. When completed in 2019 it will deliver eight new stations at Cherrybrook, Castle Hill, Showground, Norwest, Bella Vista, Kellyville, Rouse Hill and Cudgegong Road, five upgraded stations and 4000 commuter car parking spaces. It will provide 15 rapid transit trains an hour. Working together with major upgrades to the Western Line, Sydney Metro City and Southwest will deliver the capacity to increase the number of trains entering the CBD across the entire Sydney railway system from 120 to about 200 in the busiest hour of the day.
Sydney Light Rail when completed in 2019 will connect Circular Quay along George Street to Central Station, the Moore Park sporting and entertainment precinct, Randwick Racecourse, the University of NSW and Prince of Wales Hospital at Randwick. It is an integral part of the NSW Long Term Transport Plan and aims to reduce congestion.
WestConnex is Australia’s largest urban road project and will link western and south-western Sydney with the city and airport in a 33 kilometre continuous motorway. The project is to be delivered in three stages and will be complete in 2023. It is anticipated that it will ease congestion and save commuters 40 minutes when travelling from Parramatta to Sydney Airport and create 10 kilometres of bus lanes, halving the bus travel times from Burwood to the CBD.
NorthConnex is a nine-kilometre tunnel motorway which will link the M1 Pacific Highway at Wahroonga to the Hills Motorway at West Pennant Hills. The tunnel is expected to be open in 2019. The NSW Government’s State Infrastructure Strategy and NSW Long Term Transport Master Plan recognise the link as important infrastructure for freight and the wider connectivity within NSW to reduce congestion and improve traffic flow along Pennant Hills Road.
More public transport services
New public transport timetables in October 2013 delivered an additional 1190 rail, 6900 bus and 220 ferry services each week across the metropolitan area.
Making journey planning easier
Apps that provide real time information about public transport timetables and service disruptions are now available, along with improvements to the journey planning website.
Opal card, a pre-pay card launched in December 2012, can be used on trains, buses, ferries and light rail. It has reduced queues at stations, encouraged people to use public transport and reduced paper ticket waste.
Walking and cycling
There are a range of pedestrian and cycling initiatives being implemented. These will encourage people to leave their car at home and use alternatives to help reduce carbon pollution, improve air quality and maximise the capacity of the existing road network. Major work commenced on Wynyard Walk in 2012; when completed in 2016 it will provide a fully accessible pedestrian link between Wynyard Station and the developing CBD western corridor and Barangaroo.
Future opportunities
Integrated coordinated strategic approaches to planning are required to help reduce the impacts of population growth on both metropolitan and non-metro areas of NSW. Planning of new residential areas should take into account the ease and viability of public transport to key services and various CBDs in the Sydney region.
Raising public awareness of the environmental benefits of using public transport could increase its use.
References
BTS 2014, Household Travel Survey Report 2012/13, Bureau of Transport Statistics, Sydney [bts.nsw.gov.au/Statistics/Household-Travel-Survey/default.aspx#top] Cited in: Ch 4(1); Ch 4(2); Ch 4(3); Ch 4(4); Ch 4(5); Ch 4(6); Ch 4(7); Ch 4(8); Ch 4(9); Ch 4(10); Ch 4(11); Ch 4(12); Ch 4(13)
Infrastructure NSW 2012, First Things First: The State Infrastructure Strategy 2012–2032, Infrastructure NSW, Sydney [www.infrastructure.nsw.gov.au/expert-advice/state-infrastructure-strategy-2012.aspx] Cited in: Ch 4
Infrastructure NSW 2014, State Infrastructure Strategy Update 2014: Recommendations to the NSW Government, Infrastructure NSW, Sydney [www.infrastructure.nsw.gov.au/expert-advice/state-infrastructure-strategy-update-2014.aspx] Cited in: Ch 4
NSW Government 2012, NSW Long Term Transport Master Plan, Transport for NSW, Sydney [www.transport.nsw.gov.au/content/nsw-long-term-transport-master-plan] Cited in: Ch 4
NSW Government 2014, A Plan for Growing Sydney, NSW Department of Planning and Environment, Sydney [www.planning.nsw.gov.au/Plans-for-Your-Area/Sydney/A-Plan-for-Growing-Sydney] Cited in: Ch 4; Ch 1
TfNSW 2012a, Sydney's Light Rail Future: Expanding public transport, revitalising our city, Transport for NSW, Sydney [www.transport.nsw.gov.au/publications/sydneys-light-rail-future] Cited in: Ch 4
TfNSW 2012b, Sydney's Rail Future: Modernising Sydney’s Trains, Transport for NSW, Sydney [www.transport.nsw.gov.au/publications/sydneys-rail-future] Cited in: Ch 4
TfNSW 2013a, Sydney's Bus Future: Simpler, faster, better bus services, Transport for NSW, Sydney [www.transport.nsw.gov.au/content/sydneys-bus-future] Cited in: Ch 4
TfNSW 2013b, Sydney’s Cycling Future: Cycling for everyday transport, Transport for NSW, Sydney [www.transport.nsw.gov.au/sydneys-cycling-future] Cited in: Ch 4
TfNSW 2013c, Sydney's Ferry Future: Modernising Sydney’s Ferries, Transport for NSW, Sydney [www.transport.nsw.gov.au/content/sydneys-ferry-future-modernising-sydneys-ferries] Cited in: Ch 4
TfNSW 2013d, Sydney’s Walking Future: Connecting people and places, Transport for NSW, Sydney [www.transport.nsw.gov.au/sydneys-walking-future] Cited in: Ch 4