
The NSW economy is intrinsically linked to the natural environment. It is shifting from more resource intensive industries based on extraction and primary industries, to a service based economy that has lesser environmental impacts.
The NSW Government employs a range of economic tools to analyse environmental issues, including cost–benefit analysis, market-based instruments and program evaluations.
Economic instruments such as levies or taxes, subsidies, tradeable permits and performance based regulatory charges offer a flexible way to meet environmental quality objectives with lower cost, by facilitating market responses to address environmental concerns.
Environmental accounts which supplement traditional economic accounts are emerging as a focal point for the systematic collection of integrated environmental-economic information, to guide sustainable decision-making and enable environmental considerations to be incorporated into decisions that have traditionally been based predominantly on economic factors.
Related themes: 1 Population | 3 Energy consumption | 7 Waste and recycling
Context
Economic growth (the increase in the production of goods and services in an economy over time) is influenced by a variety of factors, including population growth, improved productivity, new technologies, and growth in human capital (e.g. education). Economic growth is intrinsically related to the natural environment. This interaction is not simple, with different aspects of economic growth having different environmental impacts.
Population growth results in increased consumption, resource use and waste production (see Theme 1: Population), whilst improved productivity and new technologies can reduce the resource intensity of goods and services (i.e. the same amount can be produced with fewer resources). Environmental impacts will also depend on whether an economy uses domestic or imported resources, and whether the goods and services that are produced are consumed locally or exported.
As the incomes of the NSW population increase, society's willingness to pay for better environmental outcomes can be expected to increase.
Status and trends
NSW has the largest economy in Australia, contributing more than 30% to national economic output in 2014. The economic output of NSW has grown by more than 80% over the past 25 years. Since 1990, the NSW economy has sustained positive average growth of around 2.5% per annum (see Figure 2.1). Gross state product (GSP) per capita increased by approximately $18,000 over the same period, reaching $65,320 in 2014 (ABS 2014a, Table 1).
NSW is primarily a service-based economy with services contributing more than 70% of GSP in 2013–14 (ABS 2014a, Table 2).
Figure 2.1: Economic growth (annual growth in real GSP), 1990-91 to 2013-14
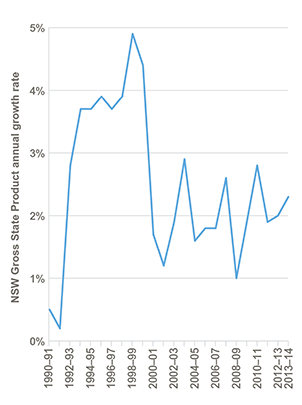
Source: ABS 2014a, Table 1
Data for Figure 2.1
Using chain volume measures to assess total industry gross value added (GVA), the five largest industries in NSW are
- finance and insurance (13.5%)
- professional, scientific and technical services (7.8%)
- manufacturing (7.5%)
- health care & social assistance (6.7%)
- construction (5.5%).
The NSW economy is shifting from more resource-intensive industries, often with larger environmental impacts, to rapidly expanding sectors less dependent on the use of natural resources. For example, while manufacturing remains a major industry in NSW, it has not kept pace with the rest of the economy. It has grown by only 9.6% in real terms over the last 25 years. The next slowest-growing industry was utilities, with electricity, gas and water services growing by only 17.5%. In contrast, over the same period the financial and insurance services sector has grown by almost 200%, overtaking manufacturing as the state's largest sector in the year 2000. The information, media and telecommunications sector was the second fastest growing industry, with real growth of 189%. Agriculture, forestry and fishing grew by 45%, while mining grew by 137% (ABS 2014a, Table 2).
Population growth in NSW has occurred at a slower rate than economic growth, averaging 1.1% since 1990 (ABS 2014b, Table 4). Over the same period, real GSP grew by an average annual rate of 2.5%, suggesting that affluence levels in NSW have increased. If NSW continues to experience economic and population growth similar to recent decades, by 2020, the state will have annual GSP of around $550 billion and a population of 8.1 million.
For the period covered by the current SoE reporting cycle the average annual increase in economic growth was 2.1%, business investment 1.1% and employment 1.3% (all recorded from July 2011 to June 2014; ABS 2014a, Tables 1 and 2; ABS 2015a, Table 4).
Pressures
Because of the inherent linkages between the environment and the economy, economic growth is likely to be achieved through the use of some additional natural resources, so there is a need to manage natural resources better in order to maintain or improve the condition of the environment.
Economic growth and the environment
The production of most goods and services in an economy is inefficient to some degree so waste is an inherent by-product of production processes. Economic growth can increase pressure on the environment’s capacity to receive and break down waste without causing significant ecological harm (see Theme 7: Waste and recycling).
Waste products such as solid waste, sewage, hazardous waste, and atmospheric emissions, place stress on the environment. Such impacts have been observed in the Hunter region, where population growth and industrial expansion have created the need for interventions to track changes in air quality and reduce the impact of saline discharges on waterways (Newcastle Lower Air Quality Monitoring Network; Hunter River Salinity Trading Scheme).
While drivers of economic growth and certain industrial processes can place pressure on the natural environment, it is important to note that environmental pressures are not necessarily proportionate to growth rates. Policy changes, technological progress and changing behaviour can effectively reduce the rate of environmental harm over time as population and economic growth continues. Figure 2.10 in SoE 2012 (EPA 2012a) showed an improvement in measures of air quality (e.g. 40% reduction in VOCs) between 1992 and 2008 while population increased by 18% and GSP grew by 68%.
Sustained economic growth relies on a continuous supply of energy. Fossil fuels currently meet around 93% of the state’s primary energy demand (see Figure 3.2 in Theme 3: Energy consumption).
The energy consumed by NSW households and businesses may not be growing quite as fast as the economy, but the state’s demand for large amounts of energy is unlikely to diminish. NSW consumption of petroleum products grew by 24% between 2002–03 and 2012–13, while the NSW economy grew by 25% over the same period (BREE 2014; ABS 2014a, Table 1). Despite the growth in renewable sources of energy, the NSW economy is likely to continue to source most of its energy from high-carbon non-renewable resources into the foreseeable future (Wood et al. 2012).
Responses
Current use of economic analysis
Economic analysis is used to support appropriate policies and to make decisions that either improve environmental outcomes at least-cost or provide the greatest net benefit to the NSW community. These assessments help the NSW Government meet its commitments to reduce the costs of regulation to industry and the community and provide conditions that increase the competitiveness of doing business in NSW. In addition, economic instruments can provide policymakers with an alternative to traditional regulation for delivering environmental outcomes at minimal cost to businesses and the community.
Economic analysis is currently used by the NSW Government to:
- assess the costs and benefits of proposed environmental standards, policies or investments, to identify the least-cost options to achieve specific environmental outcomes
- change the behaviour of industry or the community via market-based instruments and economic incentives
- assess the economic impacts of environmental programs.
Cost–benefit analysis: regulatory review and environmental evaluation
All environmental regulations in NSW undergo a cost–benefit analysis to ensure the regulatory options adopted deliver the greatest net benefits to society. This is a legislative requirement (Subordinate Legislation Act 1989) that requires NSW agencies to develop regulations and environmental standards that have well-defined objectives and that consider the compliance and administration costs to industry and government along with the economic and environmental benefits to the broader community.
However, there are challenges with quantifying the environmental impacts of policy decisions. The economic values of environmental goods and services can be estimated using a range of techniques, some of which incorporate established market values while others may provide upper or lower bounds for non-market values.
In its Environmental Policy Analysis: A Guide to Non-Market Valuation (Baker & Ruting 2014) the Australian Productivity Commission provides an overview of revealed and stated preference measures for environmental valuation. Stated preference techniques (e.g. choice modelling) can be used to identify consumers’ preference for non-market goods, such as the value of species preservation.
Revealed preference techniques, such as the travel-cost method, can be used to estimate the costs that visitors incur while travelling to a particular location as a proxy for the amount they are willing to pay for recreation. Likewise, the damage-cost approach can be used to estimate people’s revealed health costs from exposure to air pollution, allowing the benefits from reducing pollution to be quantified.
Table 2.1: Summary of recent cost–benefit analyses conducted by the EPA
| Instrument | Benefits | Costs | Net benefit | Sources |
|---|---|---|---|---|
| Radiation Control Regulation | $68.3 million | $4.9 million | $63.4 million | EPA 2012b, p.29 |
| Waste Regulation | $38.9 million | $24.9 million | $13.9 million | EPA 2014a, p.7 |
| UPSS Regulation | $485 million | $303 million | $130 million | EPA 2014b, p.26 |
| Contaminated Land Management | $0.4 million | $0.4 million | $0 million | EPA 2013, pp.23–4 |
| Environmental Penalties | $12.5 million | $0.8 million | $11.7 million | (unpublished) |
Notes: Costs and benefits are over five years, discounted to present values
The process of cost–benefit analysis improves our understanding of the links between economic activity and environmental outcomes and ensures that policies explicitly take environmental factors into account to achieve optimal outcomes for current and future generations. Table 2.1 summarises some recent assessments of the costs and benefits of proposed changes to NSW environmental legislation.
Use of economic instruments in environment protection
Economic instruments encourage behavioural responses to market forces, to help address the environmental concerns of the wider community in a more flexible way, with less cost and with less government intervention. Economic instruments include taxes, subsidies, offsets, tradeable permits and financial incentives.
A range of economic instruments are used currently in NSW to improve both economic efficiency and environmental outcomes. Examples include:
- the waste levy, which provides financial incentives for residents and businesses to reduce the amount of waste they send to landfill
- BioBanking, which allows developers to clear native bushland for a new development, as long as they conserve a comparable piece of bushland elsewhere
- biodiversity offsets (OEH 2014) encourage prospective developments at the same time as conserving nature
- the Hunter River salinity trading scheme allows industry participants to trade with each other for the right to discharge saline wastewater, without placing excessive pressure on the river’s ecosystem
- the load-based licensing scheme imposes a charge on NSW industrial facilities for each tonne of pollution they emit, encouraging these businesses to incorporate the wider social costs from pollution into their production decisions.
Risk based licensing was recently initiated by the EPA to match the degree of regulatory oversight with the level of environmental risk posed by licensed operations in NSW, targeting poor performers and creating a financial incentive for facilities to improve their systems and performance.
The ultimate goal of economic instruments is to provide incentives for businesses and the community to consider the wider social impacts of their behaviour, thereby encouraging economic growth at the same time as achieving more efficient resource allocation.
Program evaluations
Economic analysis is also used in NSW to evaluate the success of environmental programs and to identify possible improvements. In addition to identifying program improvements that reduce costs or increase benefits, evaluations can identify efficiencies and competitive advantages for participants. The waste levy was recently reviewed (KPMG 2012) resulting in a number of recommendations for program improvement.
Economic reviews are currently underway for load-based licensing, the Hunter River salinity trading scheme and NSW biodiversity legislation. The pending review of NSW Aboriginal heritage regulations will be based on achieving better outcomes for the community while minimising costs to businesses and the Government.
Emerging use of economic analysis
Emerging uses of economic analysis by the NSW Government include:
- strategic planning of new national park purchases
- predictive modelling to identify drivers of land clearing
- the potential mapping of biodiversity to strengthen offset markets
- stricter penalties to reduce the financial incentives from illegal behaviour
- measures to make it easier for people to obey laws related to illegal dumping.
Most of these emerging analyses would benefit substantially from having better access to spatially available integrated socioeconomic data that would help guide forward-looking policies. Integrated environmental-economic accounts are likely to be a key source of this information.
Environmental-economic accounting
Rationale and history
The System of National Accounts (SNA) tracks the changes in an economy over time in terms of industry production, income, investment, household consumption, among others. However, economic indicators tell only part of the story of how a society is progressing over time. There are also social and environmental measures of progress that may be developing at faster or slower rates, or perhaps even declining.
Focusing only on changes in economic activity can ignore hidden pressures on land and other environmental assets, often called 'natural capital', which includes renewable and non-renewable resources as well as ecosystem services. As an example of non-renewable natural capital, growth in the NSW mining industry depends on access to the state’s mineral resources, which form a part of the NSW natural capital stock. In mid-2014, the NSW mining industry’s gross value added was $13 billion – an increase of 137% over 1990 levels (ABS 2014a, Table 2). While mining activity generates economic benefits for business and the community it depletes the stock of natural capital available for future generations.
Wild fisheries (a renewable resource) supported commercial fishing revenues of more than $90 million in 2013, charter fishing added value worth $23 million in 2012, and recreational fishing at least $1.03 billion in 2012 (McIlgorm & Pepperell 2013; McIlgorm & Pepperell 2014). If managed sustainably the natural capital (fisheries stocks) is not depleted and is available for future generations.
Environmental accounts seek to supplement the market-based information in the System of National Accounts, thereby allowing stakeholders to compare and contrast aggregate measures, indicators and trends across a broad range of environmental and economic issues. Environmental accounts data includes trends in the use and remaining stock of natural resources and the amount of pollution and waste discharged to the environment. This helps decision-makers explore relationships between the economy and the environment (UN 2012, p.4).
The integrated approach came from the need to form decisions about current and future social welfare and environmental health using not just the standard (economic) information in national accounts, but also information from ‘real-world’ accounts of available natural resources.
System of Environmental-Economic Accounting: International application
Developed by the United Nations, the System of Environmental-Economic Accounting (SEEA) provides a framework for collating the statistics and data necessary to monitor interactions between the economy and the environment in order to better inform decision-making. The SEEA reflects the realisation that economic prosperity depends on the capacity of the natural environment to supply resources and to absorb pollution, and that environmental policies impact economic activity (ABS 2015b). The SEEA Central Framework was adopted by the UN Statistical Commission as an international statistical standard in 2012.
The SEEA Central Framework uses a systems approach to organise environmental and economic information that covers the stocks and flows of natural resources that are relevant to the analysis of a set of specific environmental and economic issues. The approach used by the SEEA Central Framework applies the same accounting concepts, structures, rules and principles as the SNA.
Environmental accounts deliver an important extension to the national accounts. In practice, these accounts can include physical supply and use tables, functional accounts (e.g. environmental expenditure), and asset accounts for the management of natural resources (UN 2012).
Adoption of SEEA in Australia and NSW
Because a diverse range of government agencies would be involved in collecting the information needed for a national (and statewide) SEEA, it is important that special attention is paid to standardising the metrics and methods by which they are measured. At the national level, the Australian Bureau of Statistics (ABS) is taking the lead by establishing an Australian Environmental-Economic Accounts (AEEA) system that uses common standards and measures consistent with the SEEA. Initially, the AEEA will concentrate on monitoring the economic value of tradable assets like timber and water, while following stages will expand the system to include the value of ecosystem services (flows of environmental values) (ABS 2015b).
The ABS has already produced experimental environmental accounts for land, energy, fish, minerals, water, waste, greenhouse gas emissions, environmental expenditures and taxes. In 2015, the ABS released the first national-level Australian Environmental-Economic Accounts report (ABS 2015b). These reports generally contain aggregate national statistics, with little to no state-level data.
The information contained in environmental accounts can provide a continuous measure of the extent and condition of stocks of natural capital, flagging the sustainability of different activities and the resource efficiency of various industries. This will allow public agencies to develop policy responses to environmental trends as they are identified.
While no state-level environmental accounts have been produced, the ABS has released national water accounts that include some broad state-level data (ABS 2014c). These data were also reproduced in the first Australian Environmental-Economic Account in 2015 (ABS 2015b). Figure 2.2 shows the scale of annual water consumption (GL) by various NSW industries and by households.
It is clear that agriculture is by far the largest consumer of water resources in NSW. By contrast, the amount of water consumed by the mining, manufacturing and electricity production sectors in NSW is relatively small.
While there are no obvious trends in water consumption by other sectors the consumption of water by agriculture is rising over the period covered by regular annual water accounts (2008 to 2013), depicted in Figure 2.2.
Figure 2.2: NSW water consumption over time, by major industries and households
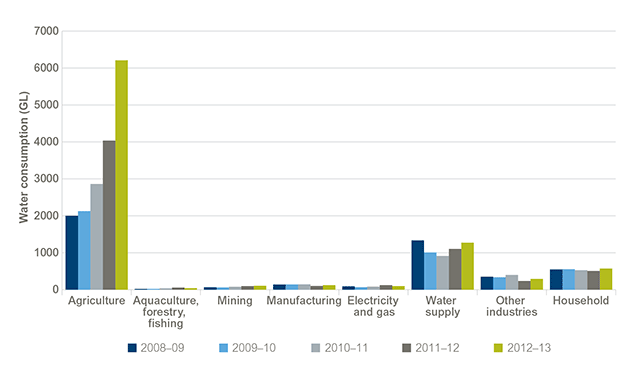
Source: ABS 2014c, Table 2
Data for Figure 2.2
However, care needs to be exercised in interpreting this data on water use. There are a number of different water entitlement types in NSW. Town and industrial users receive more secure entitlements than agriculture, which effectively receives the water left after other uses have been met.
The use of water by agriculture is highly variable and average annual consumption is actually falling when considered over the longer term (see Theme 16: Water resources). Water use by agriculture is strongly dependent on climatic conditions and the seasonal availability of water. The start of the period covered by this data coincides with extremely dry conditions in NSW, whereas much wetter conditions prevailed by the end of this period.
The environmental information needed to produce viable statewide environmental accounts is not currently being collected in a sufficiently systematic fashion across NSW. The NSW Government has started a dialogue with the ABS, to explore partnership opportunities whereby a system of integrated environmental and economic accounts can be tested for smaller regions of NSW, or statewide accounts developed for specific values or issues such as land or waste management.
Future opportunities
Responding effectively to the environmental challenges presented by a growing NSW economy requires a better understanding of how the economy and the environment interact, and will need to be supported by the collection of appropriate environmental data to enable better evaluation of the outcomes of environmental policies and investment decisions.
Potential uses for environmental-economic accounts include the ability to evaluate the impact of policies implemented in different spatial locations, such as regional or facility-based pollution control measures, the socioeconomic impacts of biodiversity conservation, or measures to improve the socioeconomic impacts of new conservation areas.
Environmental-economic accounts are intended to be publicly accessible, including to researchers who can add value to information that may otherwise have been inaccessible or unavailable. This can reduce the need for costly publicly funded research and can empower local communities by providing access to environmental and economic information at regional or local scales.
References
ABS 2014a, Australian National Accounts, State Accounts, Annual NSW, cat. no. 5220.0, Australian Bureau of Statistics, Canberra [www.abs.gov.au/Ausstats/abs@.nsf/mf/5220.0] Cited in: Ch 2; Ch 5
ABS 2014b, Australian Demographic Statistics September 2014, cat. no. 3101.0, Australian Bureau of Statistics, Canberra [www.abs.gov.au/AUSSTATS/abs@.nsf/Lookup/3101.0Main+Features1Sep%202014] Cited in: Ch 2; Ch 1; Ch 3
ABS 2014c, Water Account, Australia 2012–13, Water use and consumption, cat. no. 4610.0, Australian Bureau of Statistics, Canberra [www.abs.gov.au/Ausstats/abs@.nsf/mf/4610.0] Cited in: Ch 2; Ch 16
ABS 2015a, Labour Force, Australia, April 2015, cat. no. 6202.0, Australian Bureau of Statistics, Canberra [www.abs.gov.au/AUSSTATS/abs@.nsf/Lookup/6202.0Main+Features1Apr%202015] Cited in: Ch 2
ABS 2015b, Australian Environmental-Economic Accounts, 2015, cat. no. 4655.0, Australian Bureau of Statistics, Canberra [www.abs.gov.au/Ausstats/abs@.nsf/mf/4655.0] Cited in: Ch 2; Ch 7
Baker, R & Ruting, B 2014, Environmental Policy Analysis: A Guide to Non-Market Valuation, Productivity Commission Staff Working Paper, Productivity Commission, Canberra [www.pc.gov.au/research/completed/non-market-valuation] Cited in: Ch 2
BREE 2014, Australia Energy Statistics, Bureau of Resources and Energy Economics, Canberra [www.industry.gov.au/Office-of-the-Chief-Economist/Publications/Pages/Australian-energy-statistics.aspx] Cited in: Ch 2; Ch 3
EPA 2012a, New South Wales State of the Environment 2012, NSW Environment Protection Authority, Sydney [www.epa.nsw.gov.au/soe/soe2012] Cited in: Ch 2; Ch 7; Ch 8; Ch 12(1); Ch 12(2); Ch 13(1); Ch 13(2); Ch 14; Ch 16; Ch 17; Ch 19; Ch 20(1); Ch 20(2)
EPA 2012b, Proposed Radiation Control Regulation 2012: Regulatory Impact Statement, NSW Environment Protection Authority, Sydney [www.epa.nsw.gov.au/radiation/20120469risradiatcontreg.htm] Cited in: Ch 2
EPA 2013, Proposed Contaminated Land Management Regulation 2013: Regulatory Impact Statement, NSW Environment Protection Authority, Sydney [www.epa.nsw.gov.au/clm/130403risclm.htm] Cited in: Ch 2
EPA 2014a, Supplementary Regulatory Impact Statement: Protection of the Environment Operations (Waste) Regulation 2014, NSW Environment Protection Authority, Sydney [www.epa.nsw.gov.au/wasteregulation/reg-impact-2014.htm] Cited in: Ch 2
EPA 2014b, UPSS Regulatory Impact Statement, NSW Environment Protection Authority, Sydney [www.epa.nsw.gov.au/clm/upssris.htm] Cited in: Ch 2
KPMG 2012, Review of the NSW Waste and Environment Levy, report prepared by KPMG on behalf of the NSW Environment Protection Authority, KPMG, Sydney [www.epa.nsw.gov.au/wastetools/policymakers.htm] Cited in: Ch 2
McIlgorm, A & Pepperell, J 2013, Developing a cost effective state wide expenditure survey method to measure the economic contribution of the recreational fishing sector in NSW in 2012, report to the NSW Recreational Fishing Trust, NSW Department of Primary Industries, November 2013, produced by the Australian National Centre for Ocean Resources and Security (ANCORS), University of Wollongong [www.dpi.nsw.gov.au/__data/assets/pdf_file/0009/499302/UOW-statewide-economic-survey-final-report.pdf] Cited in: Ch 2
McIlgorm, A & Pepperell, J 2014, An economic survey of the Recreational fishing charter boat industry in NSW, report to the NSW Department of Primary Industries by Dominion Consulting Pty Ltd Cited in: Ch 2
OEH 2014, NSW Biodiversity Offsets Policy for Major Projects, NSW Office of Environment and Heritage, Sydney [www.environment.nsw.gov.au/biodivoffsets/bioffsetspol.htm] Cited in: Ch 2
Wood, A, Edis, T, Morrow, H & Mullerworth, D 2012, No Easy Choices: Which way to Australia’s energy future?, Grattan Institute, Melbourne [http://grattan.edu.au/report/no-easy-choices-which-way-to-australias-energy-future/] Cited in: Ch 2
UN 2012, Revision of the System of Environmental – Economic Accounting (SEEA): SEEA Central Framework, prepared by the Committee of Experts on Environmental Economic Accounting, United Nations [unstats.un.org/unsd/envaccounting/White_cover.pdf] Cited in: Ch 2