
As population has risen, so has population density. In NSW in June 2014 there were 9.4 people per square kilometre, a 6% rise since 2009. In Greater Sydney at June 2014, there were 390 people per square kilometre, 27 more people per square kilometre than in 2009.
A rising population, increasing urbanisation and an ageing population (15% of the NSW population were 65 or over in June 2014) leads to greater demand for housing, energy and water as well as an increase in waste being generated. The increasing demand for land can also lead to loss of green spaces and greater pressure to develop the urban-rural fringe.
By 2031 the population of NSW is expected to grow to 9.23 million people with the majority of this growth anticipated to be in Sydney. A Plan for Growing Sydney is the NSW Government’s 20-year plan for the Sydney Metropolitan Area, a plan for a sustainable and resilient city with a balanced approach to the use of land resources while protecting the natural environment.
Related themes: 3 Energy consumption | 4 Transport | 6 Urban water | 7 Waste and recycling
Context
Population growth and urbanisation contribute to environmental challenges in NSW that relate to biodiversity, air quality, water resources, natural hazards and climate change. Increasing populations also lead to greater demand for public transport, more traffic on roads and more goods moving around NSW. Population also drives demand for food, the production of which can impact on the environment. In densely populated areas, waste products, such as solid waste, sewage, hazardous waste and atmospheric emissions place increased stress on natural ecosystems. Planning responsibly for this growth can avoid or minimise these impacts.
Population changes are a critical factor to inform strategic environmental planning. How many of us there are, how fast the population grows or declines and ages, where we live and how we live together, all drive the need for careful use of resources and influence our footprint on the environment.
Status and trends
Population change
The population of NSW continues to grow, as depicted in Figure 1.1. Between June 2013 and June 2014 There was an increase of 109,100 people (up 1.5% to 7.52 million), with 77% of this growth occurring in Greater Sydney. The NSW population reached 7.6 million people in March 2015 (ABS 2015a). In comparison to other states and territories in Australia this was the greatest growth (to June 2014) in terms of number of people, but the rate of growth was slightly below the average for Australia of 1.6% (ABS 2015b).
By 2031 the NSW population is projected to grow to over 9.23 million people, with the majority anticipated to live in Greater Sydney, which may put pressure on the demand for resources including energy and water.
Figure 1.1: Population growth in Greater Sydney* and NSW for the last decade
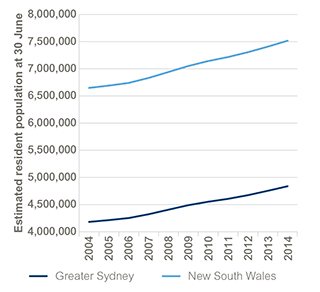
Source: ABS 2015b
Notes: * Greater Sydney extends from Wyong and Gosford in the north to the Royal National Park in the South; towards the west the region includes the Blue Mountains, Wollondilly and Hawkesbury.
Data for Figure 1.1
Population distribution
Table 1.1 depicts a 5% increase in population from 2010–11 to 2013–14 for Greater Sydney, a 2.6% increase for coastal areas and 2.7% for regional NSW.
Table 1.1: Populations June 2011 to June 2014
| Area | June 2011 | June 2014 |
|---|---|---|
| Greater Sydney |
4,608,949 |
4,840,628 |
| Coastal* |
1,684,900 |
1,728,338 |
| Regional NSW |
1,247,300 |
1,280,555 |
Source: DP&E 2014b; ABS 2015b
Notes: * Coastal includes the local government areas of Ballina, Bega Valley, Bellingen, Byron, Clarence Valley, Coffs harbour, Eurobodalla, Gosford, Great Lakes, Greater Hume Shire, Kempsey, Kiama, Lake Macquarie, Nambucca, Newcastle, Port Macquarie-Hastings, Port Stephens, Richmond Valley, Shellharbour, Shoalhaven, Tweed, Wollongong, Wyong
Greater Sydney
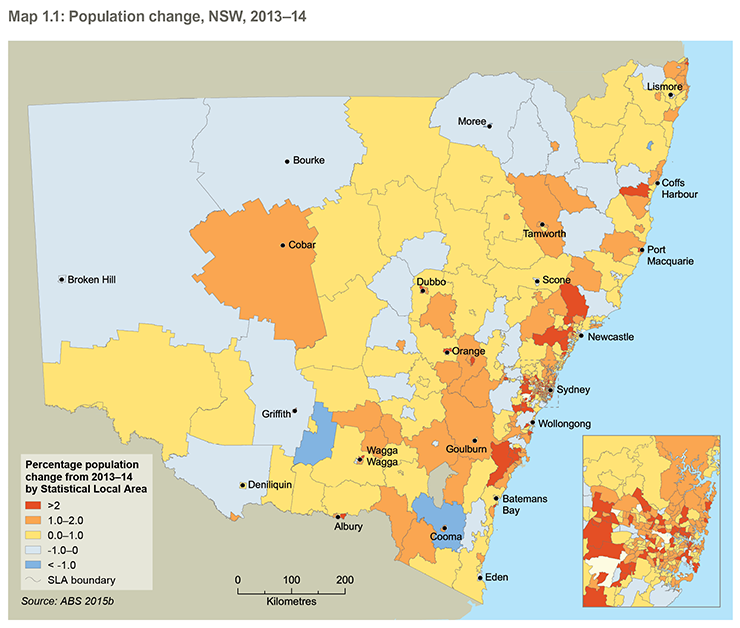
About 4.84 million people lived in Greater Sydney at June 2014, representing just under two thirds of the state’s population. Map 1.1 shows population change between June 2013 and June 2014. The largest growth in Greater Sydney between 2013 and 2014 was in Parklea – Kellyville Ridge (up by 2700 people). Large growth also occurred in Waterloo – Beaconsfield (up by 2000 people), Parramatta – Rosehill (1900), Concord West – North Strathfield (1600) and Cobbitty – Leppington (1500). Population decline has also occurred in Greater Sydney, between June 2013 and June 2014 the largest decline was in Claymore – Eagle Vale – Raby (Sydney’s south-west) down by 140 people and Springwood –Winmalee in the Blue Mountains down by 80 due to the bushfires of late 2013 (ABS 2015b).
In the last decade the largest population increases have been recorded in the local government areas (LGAs) of Blacktown (+61,000 people), Sydney (+45,450) and Parramatta (+41,050).
Rest of NSW
The population of the rest of NSW (outside Greater Sydney) increased by 24,900 people between June 2013 and June 2014 to reach 2.6 million. Map 1.1 shows that in that period the largest and fastest population growth occurred in the Hunter Valley (excluding Newcastle) which rose by 3700 people (1.4%). Substantial growth also occurred in Newcastle and Lake Macquarie (up by 3500 people), Illawarra, just south of Sydney (2800) and Richmond – Tweed on the far north coast (2200). The biggest decline in population was in Grafton on the north coast which experienced a loss of 180 people (ABS 2015b).
In the last decade the largest declines have occurred in the LGAs of Broken Hill (1050 people) and Moree Plains (950 people).
Population density
At June 2014 the population density of NSW was 9.4 people per km2 (this was a 6% increase when compared to the 2009 figure of 8.9 people per km2). The highest population densities outside Sydney as at June 2014 were in Newcastle – Cooks Hill (2800 people per km2), Waratah – North Lambton (2500) and Wollongong (2800) (ABS 2015b).
Map 1.1: Population change, NSW, 2013–14
In Greater Sydney, as shown in Figure 1.2, the population density has continued to rise since 2009. At June 2014 the population density was 390 people per km2 which is an extra 27 people per km2 in comparison to 5 years earlier (2009). The highest population densities at June 2014 were in Pyrmont – Ultimo (15,000), Potts Point – Woolloomooloo (13,700), Darlinghurst (13,400) and Surry Hills (13,300) (ABS 2015b).
Increased population density concentrates demand for energy, water and waste removal services (see Theme 3: Energy consumption, Theme 6: Urban water, Theme 7: Waste and recycling); this can be offset by a more efficient and healthy built environment (see Responses below).
Figure 1.2: Population density within Greater Sydney, 2009 to 2014
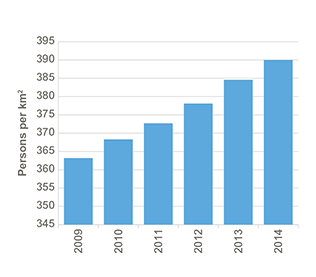
Source: ABS 2015b
Data for Figure 1.2
Size of residential properties
Table 1.2 shows that the average floor area of residential properties has substantially increased since 1984–85. Bigger homes can have negative impacts on the environment as more energy is required to light, heat and cool properties. In the process of constructing homes more waste may be generated, while the demand for more housing and larger housing can lead to conflict with other land uses and encroachment into the urban–rural fringe.
Table 1.2: Average residential floor area
|
Type of property |
Floor area m² | |
|---|---|---|
|
1984–85 |
2012–13 |
|
|
New house (detached) in NSW |
159.3 |
266.2 |
|
New other residential (not detached) in NSW |
96.6 |
151.1 |
Reasons for population growth
Population growth in NSW is driven by natural increase (the difference between births and deaths) and by net overseas migration. As seen in Figure 1.3, natural increase has been relatively stable over time. Figure 1.3 shows that net overseas migration has been an important factor influencing annual changes in population size. In 2008, net overseas migration reached a peak of 87,389 persons, which was attributed to international students arriving in the state, as well as temporary work visa holders and working holiday makers. A fall in net overseas migration saw a drop to 51,675 persons in 2011 which has since risen to 73,300 persons in 2014. Net overseas migration gains are offset by net interstate migration losses, with more people leaving NSW than arriving.
The drivers of population growth differ across the state. Population is growing faster in urban areas and regional centres than elsewhere. People move to regional centres from surrounding areas; young people move to the cities; workers and their families move to regional centres; and retirees move to popular areas on the coast, along the Murray River and in locations within easy commuting distance of metropolitan areas (DP&E 2014a). The relatively younger age profile of populations in urban areas means natural increase is also an important driver of population change.
Figure 1.3: Components of population growth in NSW, 1982–2014
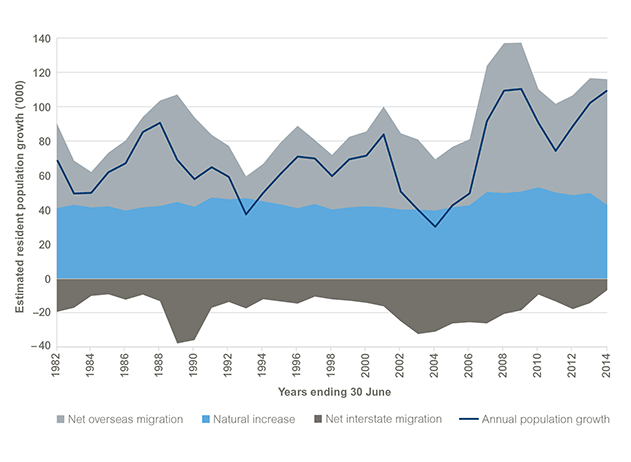
Source: ABS 2015a
Data for Figure 1.3
Age profile and population ageing
The age distribution of the NSW population continues to shift as a result of changes in fertility rates, increasing life expectancy, and age-specific migration. The population pyramid in Figure 1.4 shows that in June 1981 10% of the population of NSW was over 64 years old and by June 2014 this had grown to 15% of the population. As a result of the ageing population in NSW, household compositions are also changing with older people more likely to live alone or with only one other person. This has environmental implications caused by the need for more housing and flow-on effects from demand for housing materials and energy, water and waste consumption (see Theme 3: Energy consumption, Theme 6: Urban water, Theme 7: Waste and recycling).
Figure 1.4: NSW age profiles in 1981 and 2014
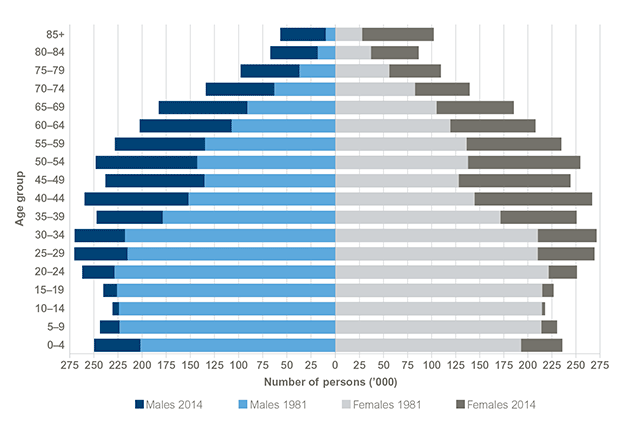
Source: ABS 2014; ABS 2015a
Data for Figure 1.4
Pressures
Larger populations create an increased demand on housing supply and increase the demand on potable water, energy and wastewater treatment. They also generate greater urban water runoff and waste. The construction of new residential homes increases construction and demolition waste and can result in the loss of green spaces and wildlife habitats. As urban areas become too densely populated pressure is put on urban fringes, which can encroach onto environmentally sensitive or potentially hazardous areas. For instance, many settlements are located in flood-prone river catchments, with tens of thousands of properties located within a floodplain. A significant portion of these are in the Hawkesbury–Nepean Valley in Sydney.
NSW experiences a range of natural hazards, including bushfires, severe storms and floods. These events cause great financial hardship for individuals and communities, and can sometimes result in loss of life. As our population grows, there is potential for more people, buildings and infrastructure assets to be exposed to natural hazards. While some of the impacts of natural hazards can be mitigated or avoided, risks cannot be completely eliminated.
NSW is now home to greater numbers of older people than ever before. This means a greater demand for aged care facilities and health care services which are often in places outside the main urban areas of the state. An ageing population also poses increased risks from the environment. For example, extreme temperatures can lead to illness and loss of life and increase the cost of transport, agriculture, energy and infrastructure. Heatwaves are also becoming more common and are a significant cause of mortality. This is particularly the case for the vulnerable sectors of society, such as the elderly, the unwell and children.
The growing population of NSW has more complex interactions with the environment that are specifically discussed further in other sections of this report.
Responses
A Plan for Growing Sydney
A Plan for Growing Sydney (NSW Government 2014) was released in December 2014. It is the NSW Government’s 20-year plan for the Sydney metropolitan area. It provides direction for Sydney’s productivity, environmental management, and liveability; and for the location of housing, employment, infrastructure and open space. It will be implemented through collaboration between a new Greater Sydney Commission and local government.
Regional plans
Regional plans will guide how a region can achieve sustainable growth and will be developed in partnership with communities, councils and businesses to set the long-term vision and actions needed to achieve the vision.
The regional plans will play a critical role in how natural resources are managed to ensure the prosperity and productivity of the NSW economy, as well as the health of local communities and the environment.
These are long-term strategic planning documents that will consider the population trends for NSW. They also articulate a vision and plan for a range of housing, jobs and infrastructure to meet the needs of a changing population. Importantly, each regional plan will include actions that relate to the environment, tailored to suit each region. Local government and the community will be central to the development and content of the regional plans.
Ageing
The NSW Office for Ageing published the NSW Ageing Strategy (OA 2012) in 2012. Through this strategy, the NSW Government will work with local councils and Local Government NSW to plan ahead and work strategically in response to population ageing.
The strategy seeks to facilitate greater housing choice and age-friendly local communities, encourage active, independent lives and safe transport, and greater participation and connectivity in civil society.
A growing population also places greater demands on interment facilities such as crematoria and cemeteries. Population projections indicate a need for the NSW Government to manage and provide for interment facilities. This is reflected by Action 1.11.5 in A Plan for Growing Sydney.
References
ABS 2005, ‘Australian home size is growing’, in: Year Book Australia 2005, cat no.1301.0, Australian Bureau of Statistics, Canberra [www.abs.gov.au/AUSSTATS/abs@.nsf/Previousproducts/1301.0Feature%20Article262005] Cited in: Ch 1
ABS 2013, ‘Average floor area of new residential dwellings’, in: Building Activity, Australia, June 2013, cat. no. 8752.0, Australian Bureau of Statistics, Canberra [www.abs.gov.au/AUSSTATS/abs@.nsf/Previousproducts/8752.0Feature%20Article1Jun%202013] Cited in: Ch 1
ABS 2014, Australian Historical Population Statistics, 2014, cat. no. 3105.0.65.001, Australian Bureau of Statistics, Canberra [www.abs.gov.au/AUSSTATS/abs@.nsf/mf/3105.0.65.001] Cited in: Ch 1; Ch 5
ABS 2015a, Australian Demographic Statistics, March 2015, cat. no. 3101.0, Australian Bureau of Statistics, Canberra [www.abs.gov.au/ausstats/abs@.nsf/mf/3101.0] Cited in: Ch 1; Ch 2; Ch 3
ABS 2015b, Regional Population Growth, Australia, 2013–14, cat. no. 3218.0, Australian Bureau of Statistics, Canberra [www.abs.gov.au/AUSSTATS/abs@.nsf/Latestproducts/3218.0Main%20Features202013-14] Cited in: Ch 1
DP&E 2014a, Statewide Profile 2014 NSW, NSW Department of Planning & Environment, Sydney [d.planning.nsw.gov.au/en-au/planningyourregion/regionalgrowthplans.aspx] Cited in: Ch 1
DP&E 2014b, New South Wales State and Local Government Area Population Projections: 2014, NSW Department of Planning & Environment, Sydney [www.planning.nsw.gov.au/en-AU/Research-and-Demography/Demography/Population-Projections] Cited in: Ch 1
NSW Government 2014, A Plan for Growing Sydney, NSW Government, Sydney [www.planning.nsw.gov.au/Plans-for-Your-Area/Sydney/A-Plan-for-Growing-Sydney] Cited in: Ch 1; Ch 4
OA 2012, NSW Ageing Strategy, Department of Family and Community Services, Office for Ageing, Sydney [www.adhc.nsw.gov.au/about_us/strategies/nsw_ageing_strategy] Cited in: Ch 1